
Figure 11.
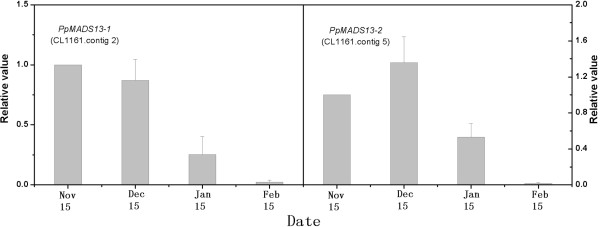
Relative expression levels determined by Q-PCR of CL 1161.contig2 and CL 1161.contig5 during dormancy. The left y-axis indicates the relative expression levels of CL 1161.contig2. The right y-axis indicates the relative expression levels of CL 1161.contig5. Bars represent the standard error (n = 3).