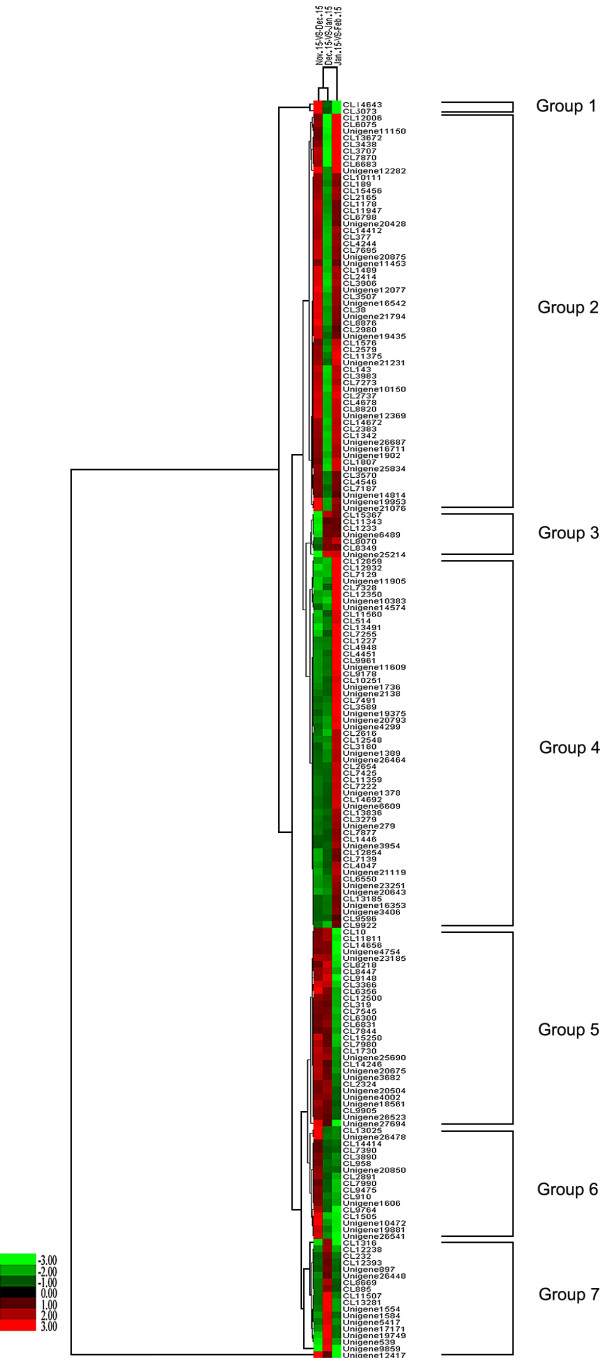
Figure 7.
Hierarchical clustering analysis of differentially-expressed genes during pear dormancy. The log2Ratio for significantly differentially-expressed genes were used. Each column represents a comparison of samples between dates (e.g., Nov. 15-VS-Dec. 15), and each row represents a gene. Expression differences are shown in different colors; red indicates up-regulation and green indicates down-regulation. The 190 genes were classified into seven regulation patterns.

