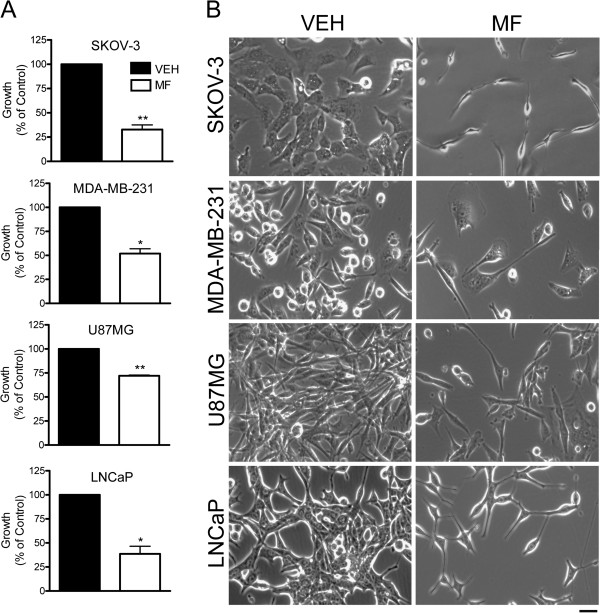
Figure 1.
Cells lines representing cancers of the ovary (SKOV-3), breast (MDA-MB-231), nervous system (U87MG), and prostate (LNCaP) display distinct morphological changes in response to mifepristone treatment. Equal number of cells were plated and allowed to attach for 24 h. Cells were then exposed to vehicle (VEH)-containing media, or media containing a previously tailored cytostatic dose of mifepristone (MF) for a period of 72 h. At the end of the experiment the total number of cells was recorded by microcytometric analysis (A) and images were taken using phase contrast microscopy (B). Cells were exposed to the following cytostatic concentrations of MF: 23.5 μM for SKOV-3, 30 μM for MDA-MB-231, and 20 μM for U87MG and LNCaP. *p < 0.01 and **p < 0.005 vs. VEH (Student’s t-test). Scale bar = 50 μm.

