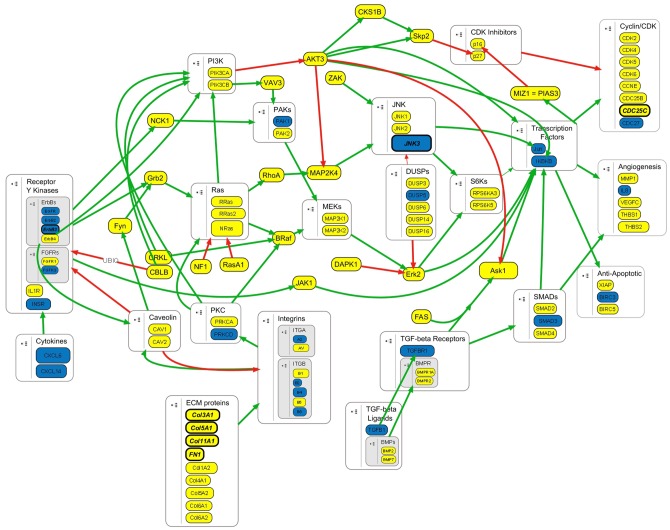
Figure 2. Altered expression in a network of Ras/MAPK associated signaling pathway genes in TCC progression.
The stimulatory and inhibitory interactions of gene products differentially expressed in T1–T4 versus Ta tumors were mapped based on KEGG pathway maps. Node color denotes relative expression: Yellow = Increased expression in muscle-invasive tumors; Blue = Decreased expression in muscle-invasive tumors. Green and red arrows represent stimulatory and inhibitory interactions, respectively. The names of genes with supported associations with muscle-invasive tumors are highlighted in bold italics.

