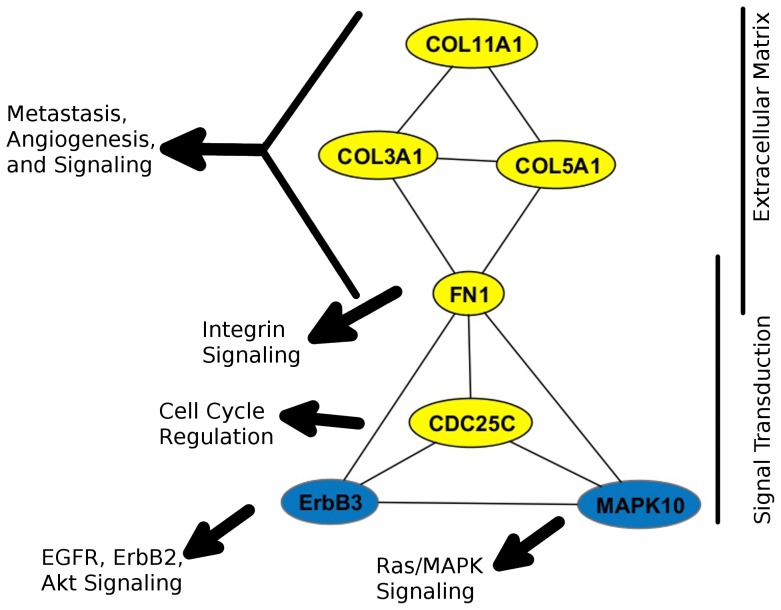
Figure 4. Bibliomic associations network in selected gene expression of muscle-invasive versus superficial tumors.
Node color represents change in expression. Edges represent functional associations identified in the literature by text-mining programs PubGene and Chilibot. Selected genes separate into two functional groups of extracellular matrix and signal transduction genes. Black arrows represent generalized groups of outside genes with functional relationships to selected genes in the literature.

