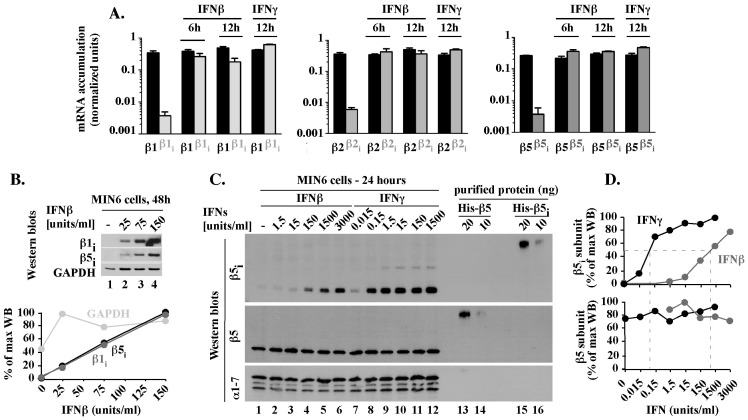
Figure 2. In MIN6 cells exposed to IFNβ, inducible and regular 20S mRNAs and proteins are expressed concurrently and in similar levels.
(A). Comparison of inducible and regular 20S mRNA levels. mRNA levels of regular (black, β1, β2, β5) or immune (gray, β1i, β2i, β5i) subunits in MIN6 cells treated with 150 units/ml IFNβ or IFNγ for 6 or 12 hours were tested by qPCR, procedure B. Results are the mean ± S.E.M. of three experiments. (B). Accumulation of inducible 20S β1i and β5i proteins. Whole cell extracts from MIN6 cells treated for 48 hours with various concentrations of IFNβ were analyzed by Western blot with antibodies specific to β5i and β1i subunits. GAPDH is shown as a loading control. Quantitation of the WB data is shown as a percentage of the maximal accumulation for each analyzed protein. (C). Comparison of β5 and β5i protein levels. MIN6 cells exposed for 24 hours to the indicated concentrations of IFNβ or IFNγ (lanes 1–12) were analyzed by Western blot next to 10 and 20 ng of mouse His-β5 and His-β5i proteins expressed in, and purified from, E. coli (lanes 13–16). Levels of the 20S alpha subunits (α1-7 WB) are shown as loading control. (D). Quantitation of WB data presented in C. Protein levels represent a percentage of the maximal accumulation for each protein.

