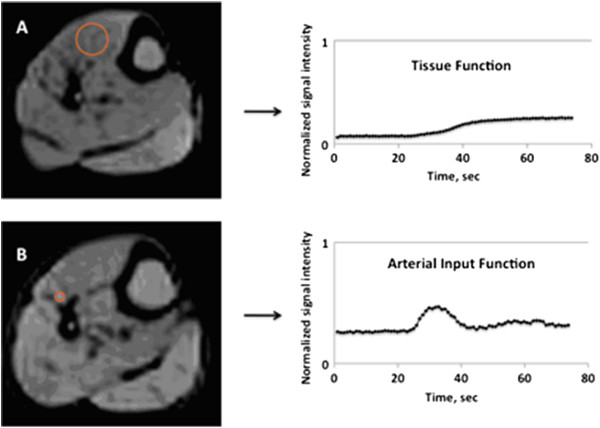
Figure 1.

The tissue function and arterial input function were normalized by proton density to compensate for variations in the receiver coil sensitivity profile. Examples of region-specific proton density measurements for the tissue function (A) and arterial input function (B) are shown, as are the corresponding normalized TF and AIF time-intensity curves.
