Figure 3.

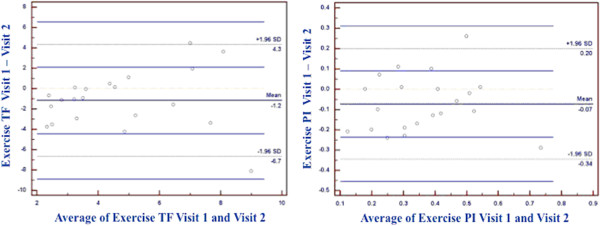
Bland-Altman plots for exercise tissue function (left) and exercise perfusion index (right) including normal and PAD participants.

Bland-Altman plots for exercise tissue function (left) and exercise perfusion index (right) including normal and PAD participants.