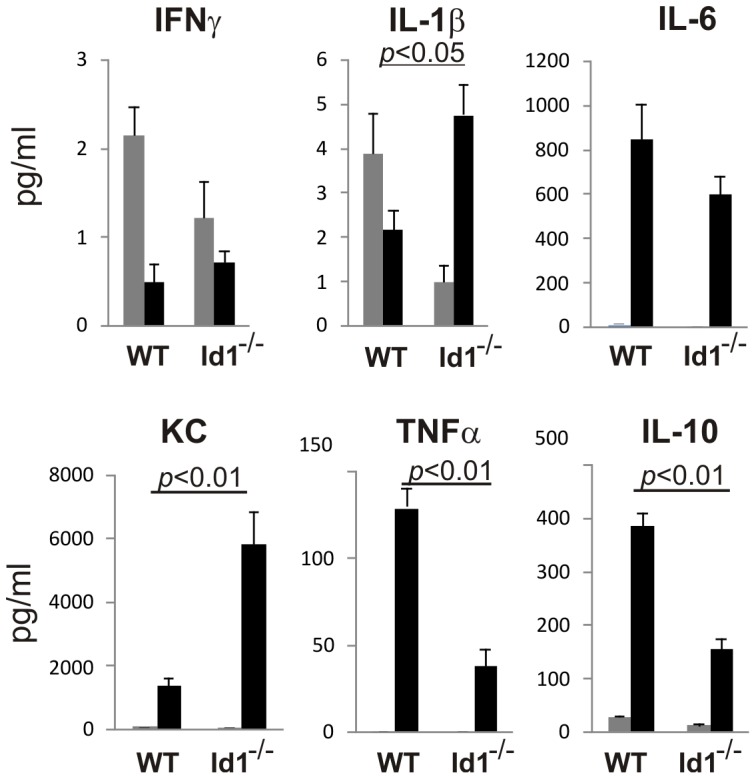
Figure 1. Cytokine production induced by chronic LPS stimulation.

Serum samples (n>6) were collected from indicated strains of mice untreated (grey bar) or treated with a daily dose of 1 µg LPS for 15 days (black bar). Indicated cytokines were measured using a multiplex assay kit as described in Method. Data shown are averages with SEM. The levels of cytokines induced by LPS in WT and Id1−/− mice were compared and statistically significant differences are indicated by showing the p values.
