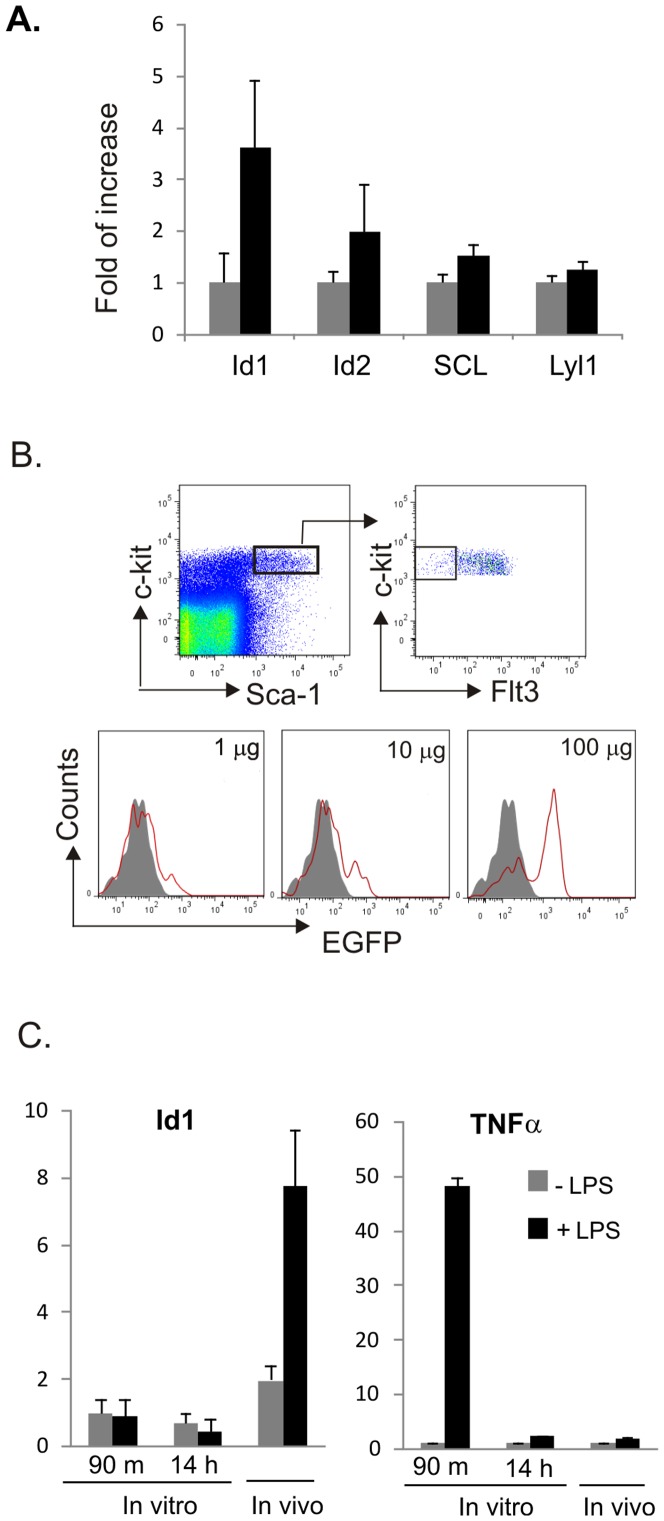
Figure 2. Induction of Id1 expression by LPS.
(A) Induction of Id1 expression by LPS in vivo. Real-time RT-PCR analyses were performed on total RNA prepared from sorted Lin−c-kit+Flt-3− bone marrow cells of wild type mice treated with (black bar) or without (grey bar) a single dose of 100 µg LPS for 48 hours. Relative levels of expression were shown as average fold of increase between untreated and treated samples with SD. (B) Expression of Id1 as indicated by EGFP fluorescence in Id1 deficient mice. EGFP expression is driven by the Id1 promoter in the knock-in construct. The Flt-3−LSK population was gated as diagrammed on the top. EGFP fluorescence of the gated cells was compared between untreated (shaded) and treated (red line) with indicated doses of LPS for 48 hours. (C) Induction of Id1 expression in vitro. LSK cells were sorted from wild type mice and incubated in medium containing SCF and Flt3-L for 6 hours. LPS was then added at a concentration of 1 µg/ml and incubated for indicated length of time. No treatment controls were set up for each time point. Samples from in vivo treatment are as described for (A). Relative levels of expression of indicated transcripts were shown as average fold of increase between untreated and treated samples with SD.

