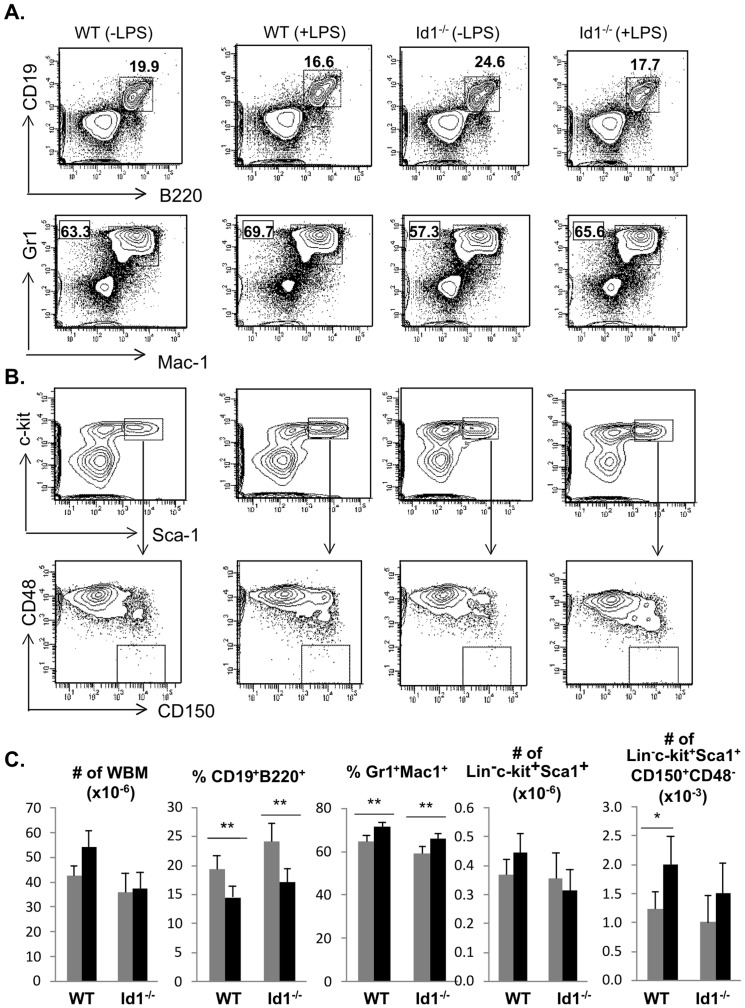
Figure 3. Examination of hematopoiesis after chronic LPS treatment.
(A) Lymphoid and myeloid differentiation. Whole bone marrow cells from WT and Id1−/− mice each treated with or without a daily dose of 1 µg of LPS for 30 days were stained with antibodies against indicated markers. Each cohort contains at least five animals. Lymphoid and myeloid cells were characterized as B220+CD19+ and Mac-1+Gr-1+, respectively. The percentages are shown next to the gates. (B) Analysis of phenotypic HSC. Lineage negative bone marrow was stained with antibodies against c-kit, Sca-1, CD150 and CD48. The LSK fraction shown in the top row was further analyzed for expression of CD150 and CD48, and the CD150+CD48− subset was considered phenotypic HSC. (C) Average numbers or percentages of indicated subset of bone marrow are shown with SD. ** p<0.01; *p<0.05.

