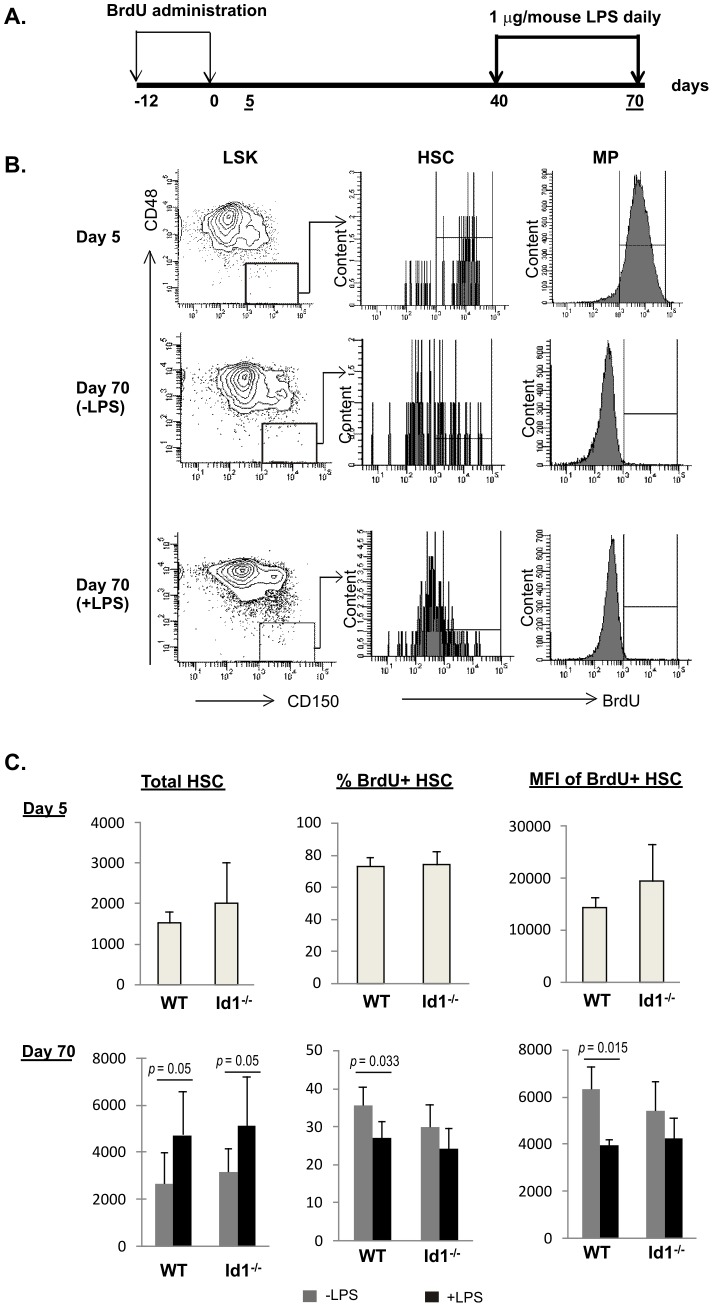
Figure 5. Label-retaining assay.
(A) Experimental scheme. Time points (days) when actions were taken are labeled and those when mice were assayed are underlined. (B) FACS analysis of BrdU incorporation on Day 5 and Day 70. FACS plots of untreated and treated WT mice are shown as examples. BrdU incorporation in CD150+CD48−LSK (HSC) and Lin−c-kit+Sca-1− myeloid progenitors (MP) populations are shown in histograms. BrdU positive gates were set with the same subsets of cells from control mice not exposed to BrdU. (C) Average values of HSC count, percent of BrdU+ HSC, and the mean fluorescence intensity (MFI) of BrdU+ cells in each cohort of 5 mice at indicated time point are shown with SD. Grey bar, untreated; black bar, treated daily with 1 µg of LPS for 30 days.

