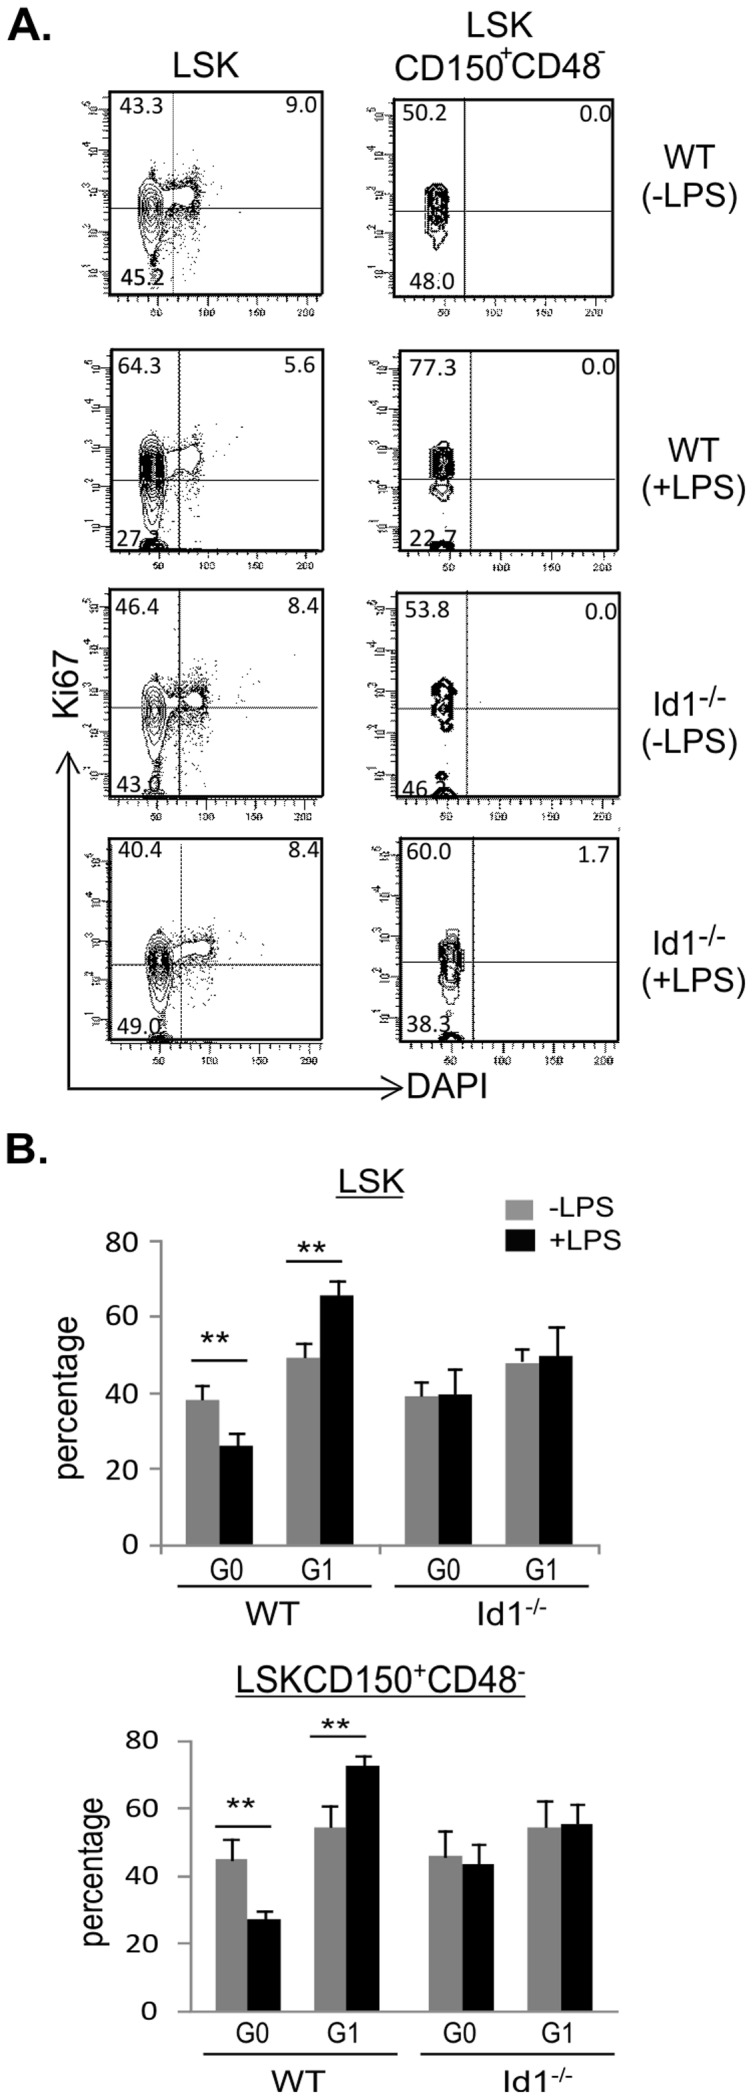
Figure 6. Analysis of cell cycle state of HSC.

(A) FACS analysis for expression of Ki67 in indicated subsets were performed by intracellular staining followed by DAPI staining for DNA content. Ki67 positive gate for each sample was set based on the level of Ki67 in cycling cells identified according to DAPI intensity of cells in the LSK population. Numbers indicate the percentage in each quadrant. (B) Average percentages of cells in G0 and G1 phases are shown with SD. Grey bar, untreated; black bar, treated with 1 µg of LPS for 30 days. ** p<0.01.
