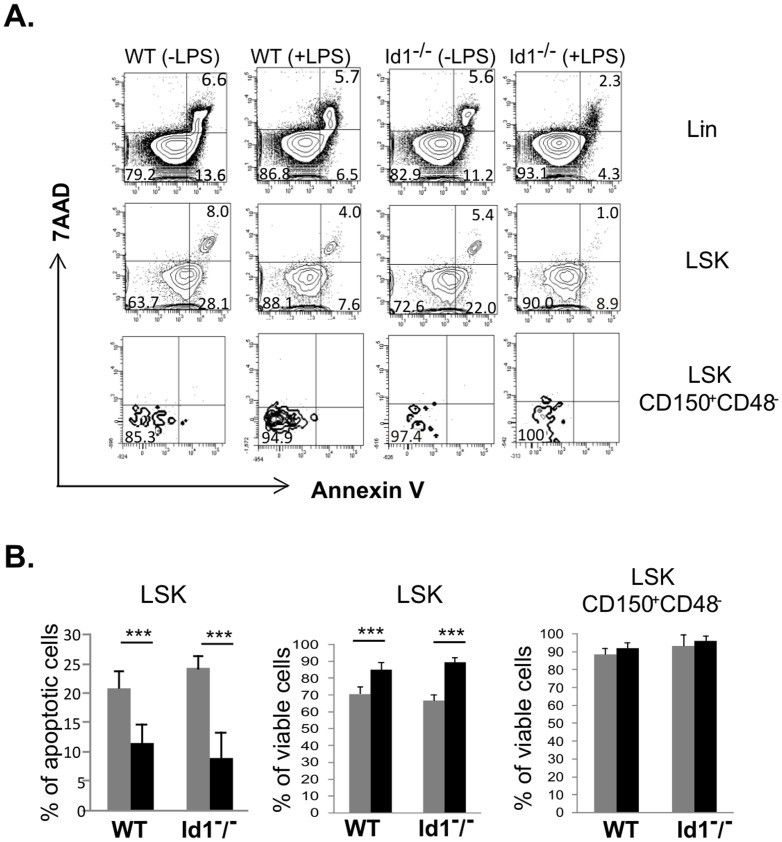
Figure 7. Analysis of apoptosis.
(A) FACS analysis of indicated subsets was performed by Annexin-V and 7AAD staining. The Annexin-V positive gate was set based on its intensity on 7AAD+ Lin− cells, which represent Annexin-V positive dead cells. Numbers indicate the percentage in each quadrant. (B) Average percentages of Annexin-V+7AAD− or Annexin-V−7AAD− (viable) cells are shown with SD. Grey bar, untreated; black bar, treated with 1 µg of LPS for 30 days. *** p<0.0001.

