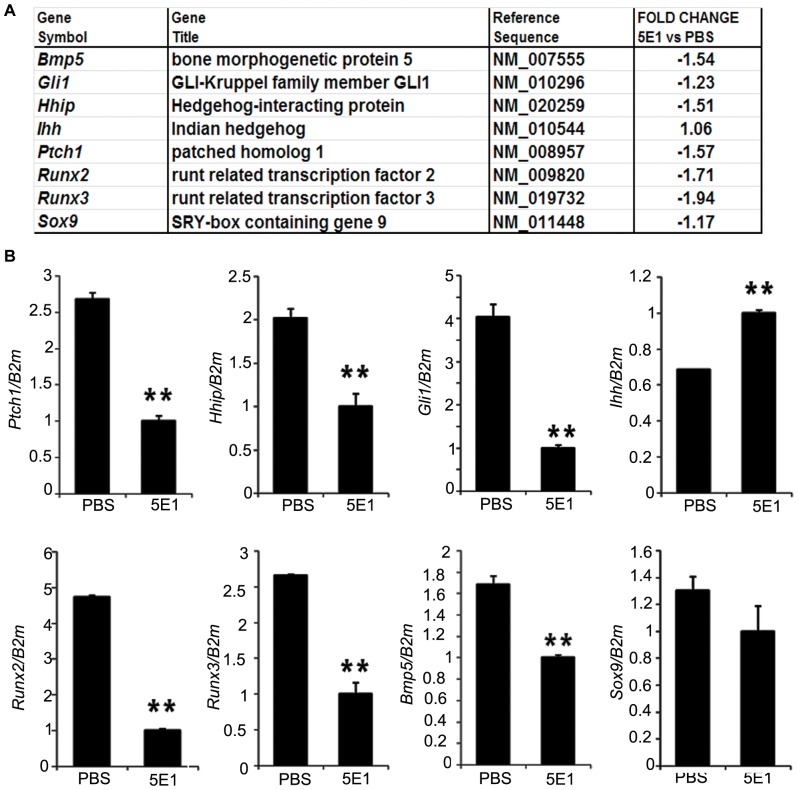
Figure 2. Microarray and RT-qPCR.
(A) A table showing the fold change in the known chondrogenesis-related genes in limb between the groups injected with either PBS or 5E1 at E12.5. As expected, Gli1, Hhip, and Ptch1 were down-regulated. Interestingly, Runx2, Runx3, and Bmp5 were down-regulated. Sox9, which is the master gene in chondrogenesis, was not altered by 5E1 treatment. (B) The results of the RT-qPCR are consistent with the microarray data. The amount of each of the RT-qPCR products was normalized using β-2-microglobulin (B2m) as an internal control. Student’s t-test was used for statistical analysis with the level of statistical significance set at (*) p<0.01 or (**) p<0.05.

