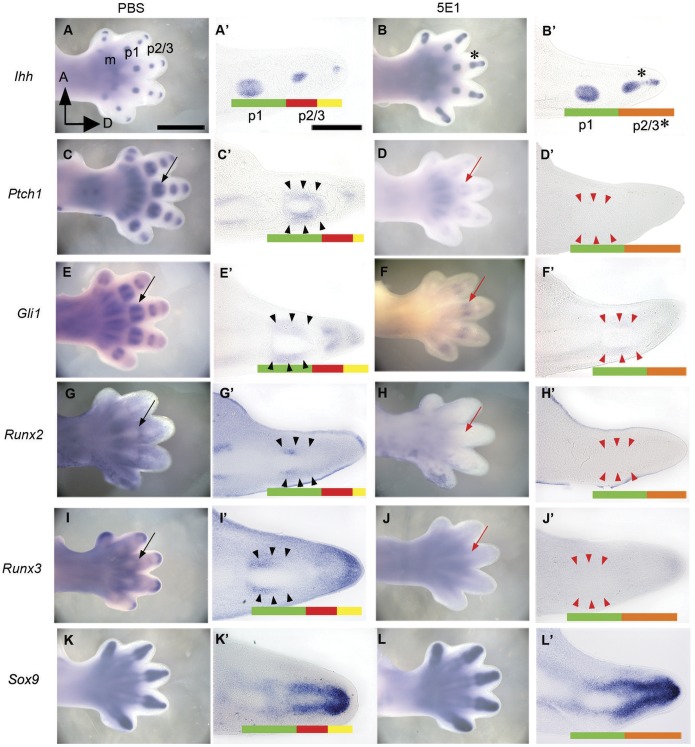
Figure 3. Expression of Ihh, Ptch1, Gli1, Runx2, Runx3 and Sox9.
(A and A’) Ihh expressed in prehypertrophic chondrocytes. (B and B’) The Ihh expression pattern was not altered when hedgehog signaling one day of 5E1 injection at E12.5. The Ihh-expressing regions in second and third phalanges were connected following the injection of 5E1, but not after injecting PBS. (C and C’, E and E’) Ptch1 and Gli1 were expressed in the mesenchymal cells surrounding the prehypertrophic chondrocytes. (D and D’, F and F’) Ptch1 and Gli1 were down-regulated due to blocking the activity of the IHH protein. (G and G’, I and I’) Runx2 and Runx3 were expressed in mesenchymal cells, similar to Ptch1 and Gli1. (H and H’, J and J’) Runx2 and Runx3 were down-regulated when 5E1 was transferred. (K–L’) Sox9 expression did not differ between the PBS- and 5E1-treated groups. p1 (green box), condensation of phalange 1; p2/3 (red and yellow box), unseparated primordium of phalanges 2 and 3; p2/3* (orange box), connecting region of Ihh expression; m, metacarpals; A, anterior; D, distal part of the limb; (A–L, scale bar = 1 mm. A’–L’; longitudinal section view, scale bar = 100 µm.).

