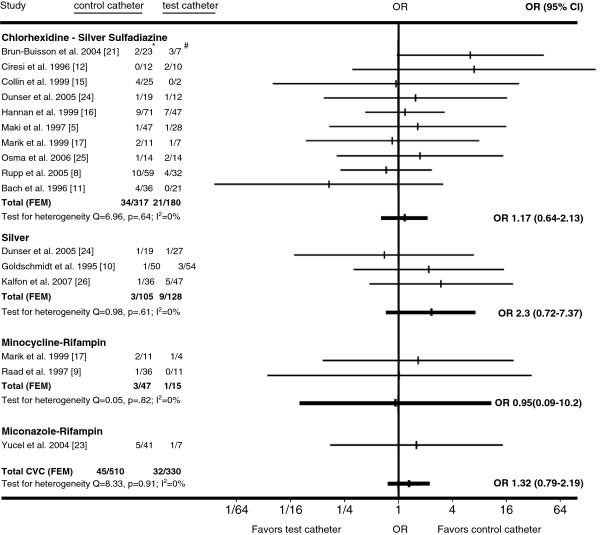
Figure 3.
Horizontal lines represent 95% confidence intervals (95% CI) of CVC colonization with S. aureus in different trials. They express the likelihood of test vs. control catheter colonization in relation to the vertical line that represents the null hypothesis of no difference between test and control catheters. For every type of catheter tested, the data from available trials was pooled and graphed as Gart fixed-effects model (FEM). If substantial heterogeneity was present, DerSimonian-Laird random-effects model (REM) results were used instead. *S. aureus colonized control CVCs/All colonized control CVCs. #S. aureus colonized test CVCs/All colonized test CVCs.

