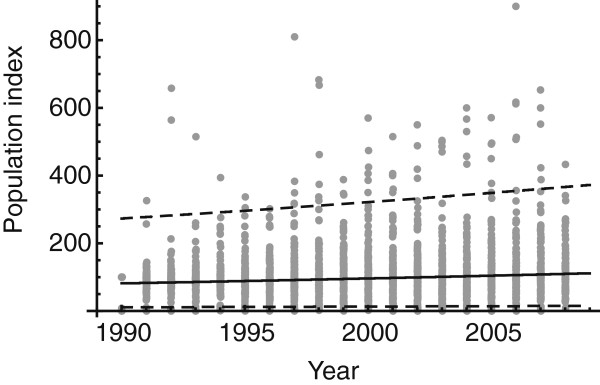
Figure 1.

Bird population densities 1980–2008. Dots represent population index values of each bird species per year. The bird population index was calculated by dividing the number of a bird species each year by the number of that bird species in the baseline year in 1990 and multiplying the result by 100. Lines represent the best-fit negative binomial distribution with the mean (solid) and the 95% confidence interval (dashed).
