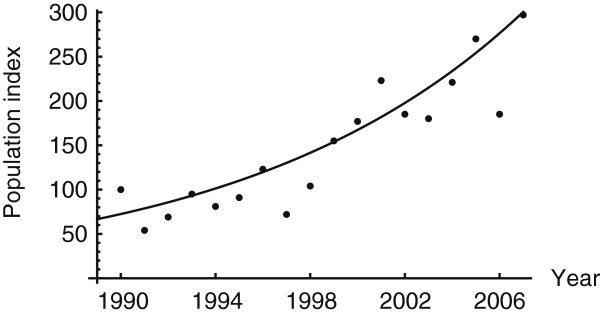
Figure 2.

Change in the number of Barn owl (Tyto alba) 1990 – 2006. The change in the number of Barn owl was calculated by dividing the number of barn owls each year by the number in the baseline year 1990 and multiplying the result by 100. The solid line is the best fit exponential function.
