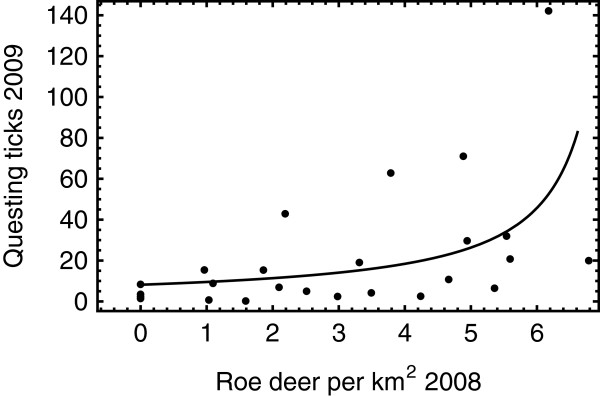
Figure 3.

Roe deer population densities and questing tick abundance. Horizontal axis is the local population density of Roe deer at all fourteen study sites in 2008. Vertical axis is the peak number of questing ticks at the corresponding study sites in 2009. The solid line is the best generalized-linear-model fit.
