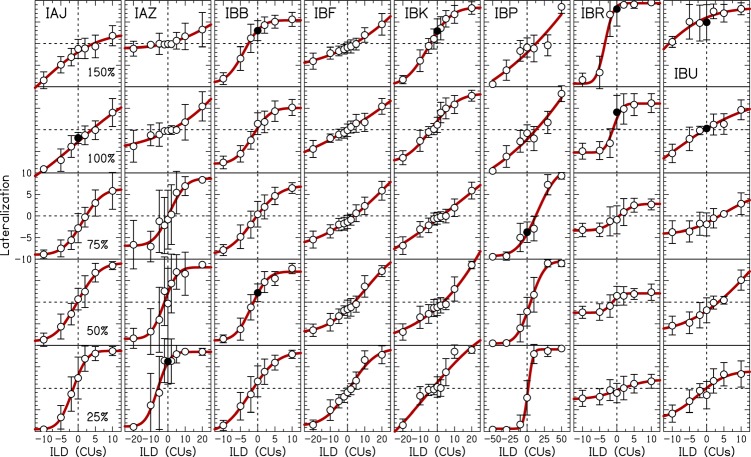
Figure 2.
(Color online) Lateralization data as a function of ILD at different stimulation levels. Individual listeners are shown in different panels. Symbols represent the average response and error bars show ±1 standard deviation. Filled symbols show where the error bars at 0-CU ILD do not overlap zero lateralization. Solid curved lines are cumulative Gaussian fits to the average data.

