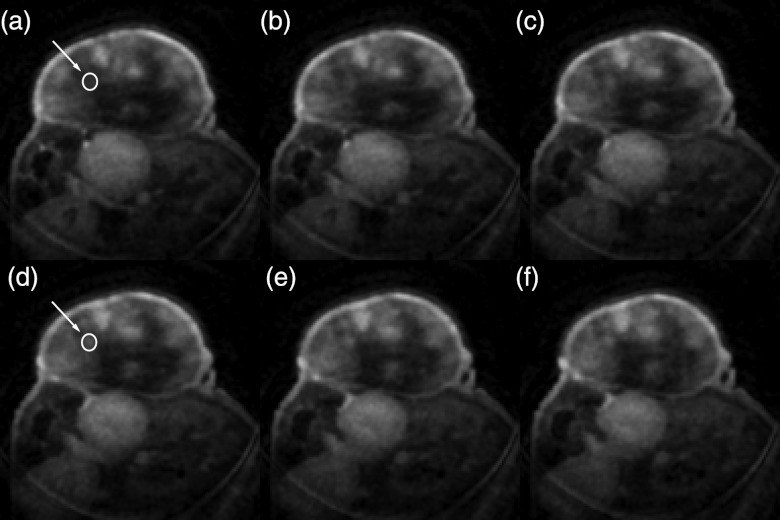
Figure 8.
Montage of six consecutive slices [slices 91–96 corresponding to panels (a)–(f)]. The arrows point to the circular ROIs, selected in slices 91 and 94, where the Ktrans values were compared. In this case, tumor heterogeneity in the z direction is being investigated. Ktrans in these two locations was significantly different. The distance between slices is 160 μm.

