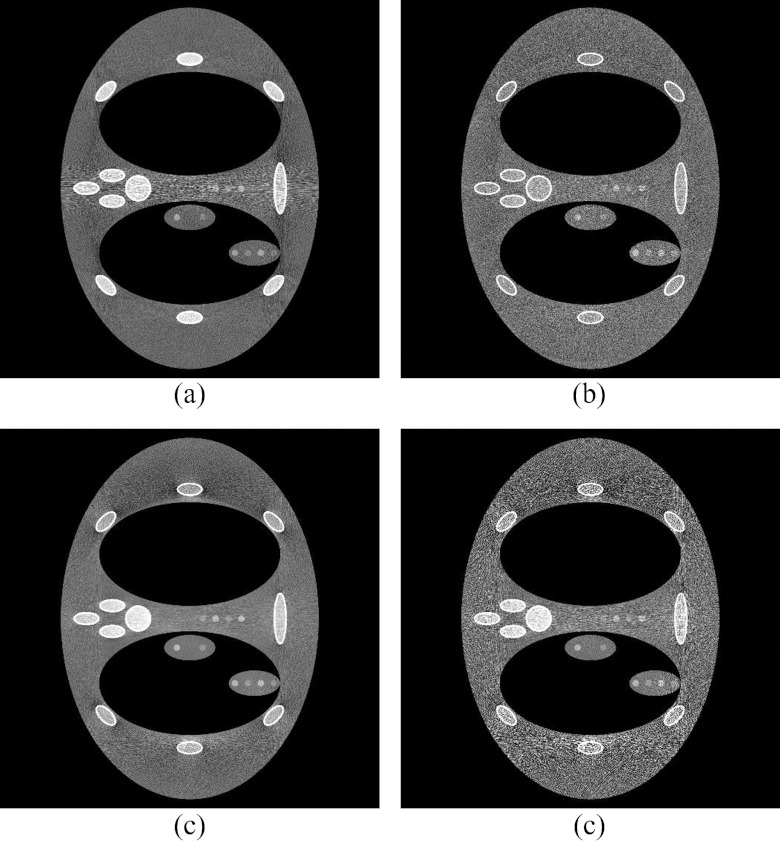
Figure 10.
A comparison between (a) flat field CT (no bowtie filter), (b) an 11 wedge DBA scan [2.77 times lower dose relative to (a)], (c) a bowtie filter CT [1.65 times lower dose relative to (a)], and (d) another bowtie acquisition at a lower dose level [5.04 times lower dose relative to (a)]. The low contrast dot detectability was matched for (a and b) and (d). The peak noise variance in between the ribs lateral to the lungs was matched for (b) and (c).

