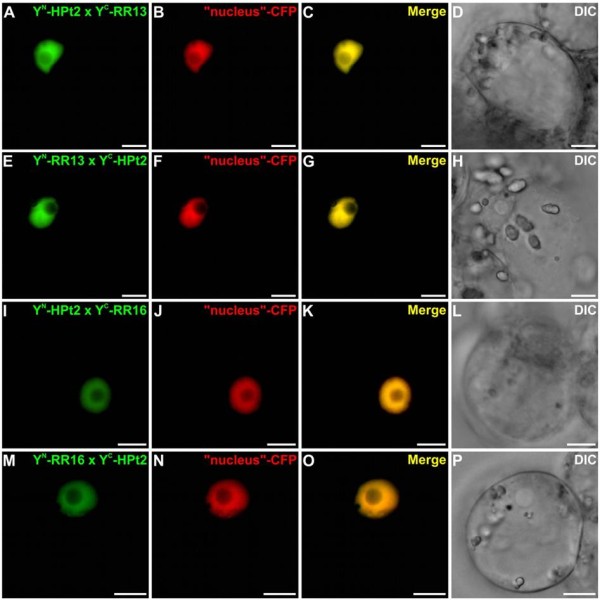
Figure 3.

Analysis of HPt2/RR13 and HPt2/RR16 interactions in C. roseus cells using BiFC assays. Cells were co-transformed using a combination of plasmids expressing HPt2/RR13 (A-H) and HPt2/RR16 (I-P) as indicated. For each combination, an additional co-transformation was performed with the CFP nuclear marker (B, F, J, N). Co-localization of the two fluorescence signals is shown in the merged image (C, G, K, O). The morphology was observed by differential interference contrast (DIC) microscopy (D, H, J, P). Scale bar = 10 μm.
