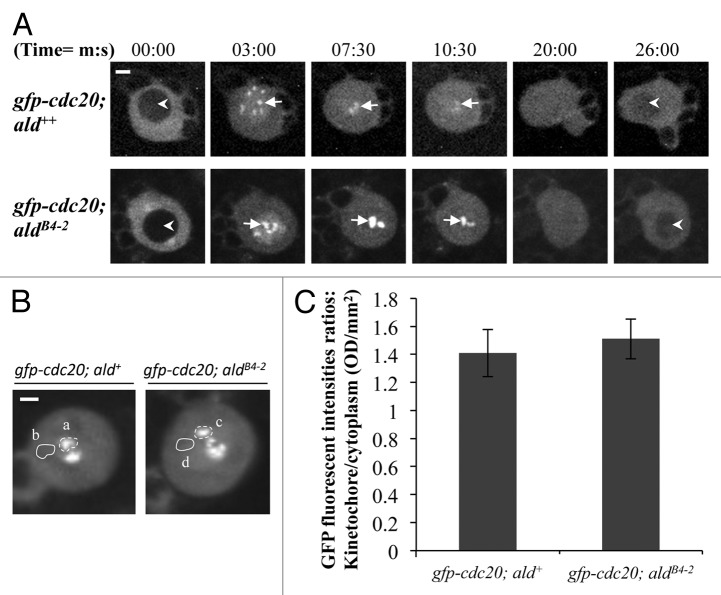
Figure 4. The level of kinetochore recruitment of Cdc20 is not affected by reduction of the Mps1 in aldB4–2 mutant. (A) Spinning disk confocal time-lapse images show GFP-Cdc20 localization patterns in third instar larvae neuroblasts from wild-type (gfp-cdc20; ald+, top panel) or Mps1 mutant (gfp-cdc20; aldB4–2, bottom panel). Arrows indicate kinetochore-associated GFP-Cdc20 signals. Arrowheads indicate the prophase nucleus just before NEB (nuclear envelope breakdown, Image at 00:00 time point) or the early interphase nucleus (Image at 26:00 time point) where GFP-Cdc20 was excluded from the nucleus. Bar = 2μm. (B) GFP-Cdc20 fluorescent intensities at prometaphase kinetochores (selected regions a and c) were quantified and compared after subtraction of the relevant cytoplasmic backgrounds (selected regions b and d). Spinning disk confocal images displaying the peak levels of the GFP-Cdc20 at the prometaphase kinetochores were taken from either the wild-type (gfp-cdc20; ald+, left) or the Mps1 mutant (gfp-cdc20; aldB4–2, right). Bar = 3 μm. (C) The graph shows the quantification results. There is no significant different between the highest intensities of the GFP-Cdc20 recruited at prometaphase kinetochores in Mps1 mutant (gfp-cdc20; aldB4–2) and in the wild-type (gfp-cdc20; ald+) neuroblasts. Twenty individual neuroblast images from each fly line were used for this quantification. Time, minutes, seconds.

An official website of the United States government
Here's how you know
Official websites use .gov
A
.gov website belongs to an official
government organization in the United States.
Secure .gov websites use HTTPS
A lock (
) or https:// means you've safely
connected to the .gov website. Share sensitive
information only on official, secure websites.
