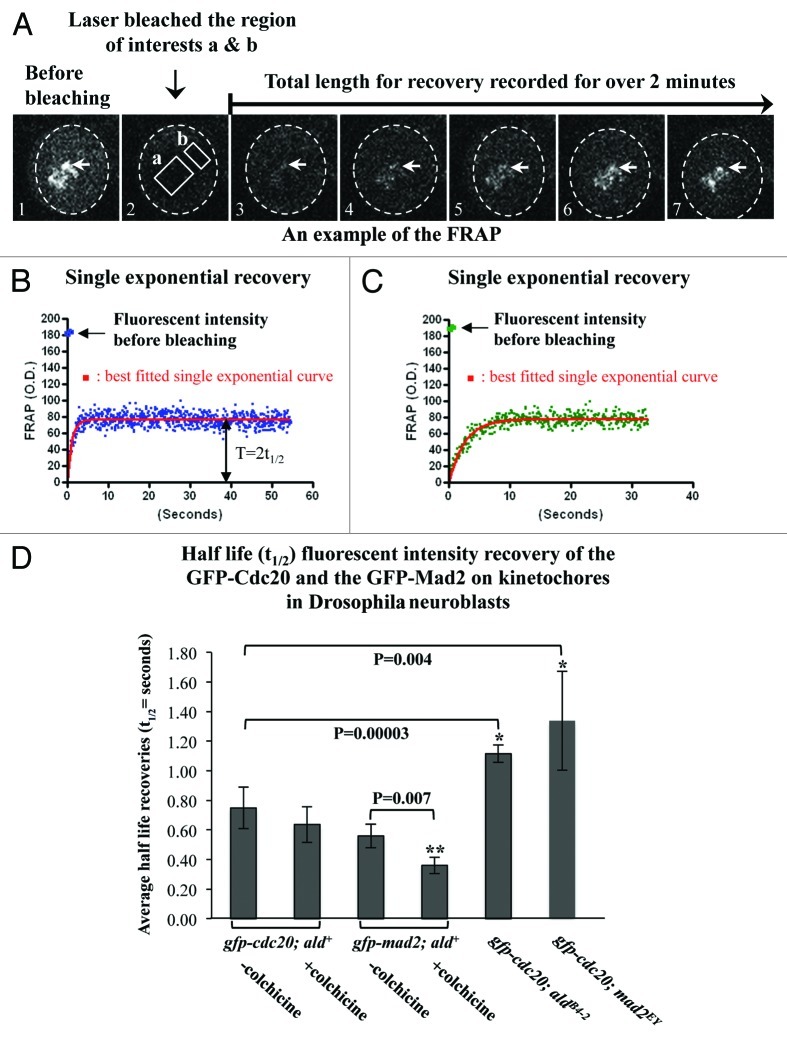
Figure 5. The absence of Mad2 causes slower Cdc20 dynamics at kinetochores. (A) An example of the FRAP experiments performed on the GFP-Cdc20 signals from a group of prometaphase kinetochores (arrows) in neuroblasts from the gfp-cdc20; ald+ wild-type line. Image A1 displays the GFP-Cdc20 fluorescent intensity on the prometaphase kinetochores before photobleaching. Image A2 shows that the GFP-Cdc20 fluorescent intensity at kinetochores in the region of interest “a” was reduced to levels equivalent to that of “b” in cytoplasm after photobleaching. Images A3–7 are selected images from the time-lapse movies showing the GFP-Cdc20 fluorescent intensity recoveries on kinetochores monitored over 2 min post bleach. The cytoplasmic area of the neuroblast is encompassed within the dashed circle in each picture. (B) An example of the normalized GFP-Cdc20 fluorescence intensity recovery time-lapse curve (blue dots) in neuroblasts from the wild-type background (gfp-cdc20; ald+ genotype). The red line represents the best-fitted single exponential curve for the GFP-Cdc20 analyzed by fitting nonlinear regression curves using GraphPad Prism. The original fluorescent intensity level before bleaching has been indicated by an arrow. The value representing the half-life recovery (t1/2) has been indicated by the double arrowheads. (C) An example of the normalized GFP-Cdc20 fluorescent intensity recovery time-lapse curve (green dots) in neuroblasts from Mps1 (aldB4–2) mutant background (gfp-cdc20; aldB4–2). The red line shows the best-fitted single exponential curve. (D) FRAP analysis results representing the half-life fluorescent intensity recoveries at prometaphase or colchicine arrested metaphase kinetochores post-photo bleach. The asterisks indicate the p values showing significant differences between the compared pairs. The numbers of the experiments used in these assays were indicated in Table 2.

An official website of the United States government
Here's how you know
Official websites use .gov
A
.gov website belongs to an official
government organization in the United States.
Secure .gov websites use HTTPS
A lock (
) or https:// means you've safely
connected to the .gov website. Share sensitive
information only on official, secure websites.
