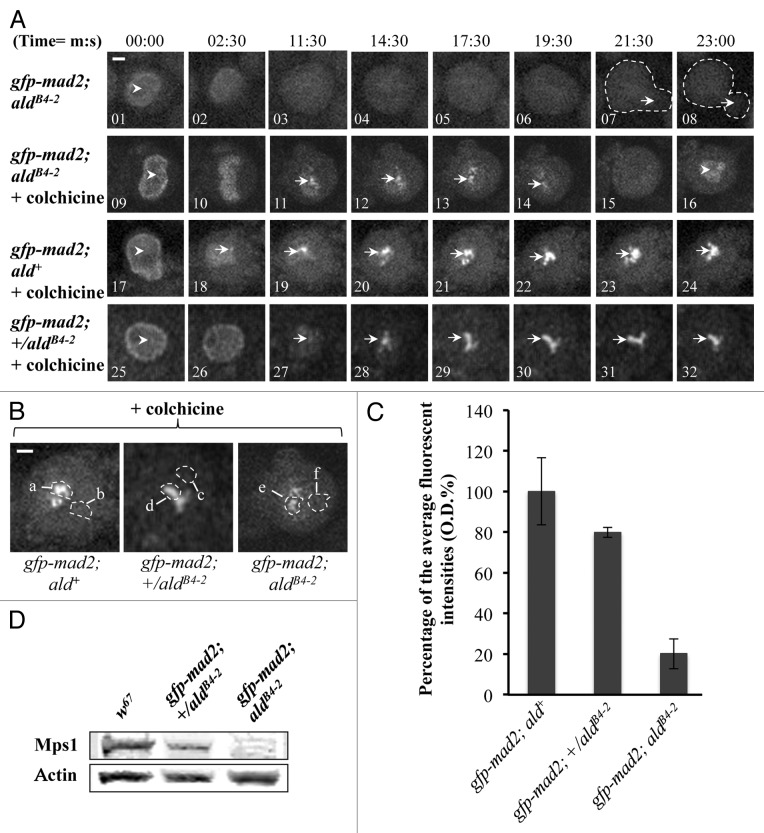
Figure 6. Kinetochore recruitment of Mad2 is insufficient for SAC signal propagation in Mps1 mutant neuroblasts. (A) Top panel: Images showing the GFP-Mad2 fluorescent signals in Mps1 (aldB4–2) mutant neuroblasts under normal mitotic progression. The arrowhead in image 1 indicates nuclear localized GFP-Mad2 at prophase. The arrows in the dashed-line circled regions in images 7 and 8 show the beginning of daughter cell formation. No kinetochore GFP-Mad2 fluorescent signals could be detected throughout the cycle. Middle panel: Images showing the GFP-Mad2 fluorescent signals in Mps1 (aldB4–2) mutant neuroblasts treated with 5 μM colchicine. The arrowhead in image 9 shows the nuclear localized GFP-Mad2 at prophase. The arrows in images 11–14 show that a certain amount of the GFP-Mad2 protein can still be recruited to the kinetochores during the time course. The arrowhead in image 16 shows that the GFP-Mad2 fluorescent signal reappears in the newly formed nucleus to indicate the mitotic progression has bypassed the SAC arrest. Bottom panel: Images showing the GFP-Mad2 fluorescent signals in wild-type neuroblasts treated with 5 μM colchicine. Cells are arrested with strong and persistent kinetochore accumulated GFP-Mad2 fluorescent signals (arrows) during the time course. The arrowhead in image 17 indicates the nuclear localized GFP-Mad2 in prophase. Bar = 2 μm. Time, minutes, seconds. (B) Spinning disk confocal images displaying the region of interests for the peak levels of the GFP-Cdc20 on the kinetochores in neuroblasts after treatment with 5 μM colchicine (region a, d and e) and the relevant cytoplasmic regions (b, c and f) used as the background subtraction. The images were taken from either the wild-type (gfp-mad2; ald+, left); the aldB4–2 heterozygotes (gfp-mad2; +/aldB4–2, middle) or the Mps1 mutant (gfp-mad2; aldB4–2, right). Bar = 3 μm. (C) The graph shows the quantified results measured from “b.” Approximately 20.2 ± 7.4% and 79.8 ± 2.42% of the wild-type levels of GFP-Mad2 can still be recruited to the kinetochores in the neuroblasts of the Mps1 mutant (aldB4–2) and heterozygous background. Twenty individual images from each cell line were used for this quantification. (D) Western blot results showing relevant Mps1 protein expression levels in wild-type, heterozygous and homozygous of the aldB4–2 third instar larvae brain samples. Actin bands act as the loading control.

An official website of the United States government
Here's how you know
Official websites use .gov
A
.gov website belongs to an official
government organization in the United States.
Secure .gov websites use HTTPS
A lock (
) or https:// means you've safely
connected to the .gov website. Share sensitive
information only on official, secure websites.
