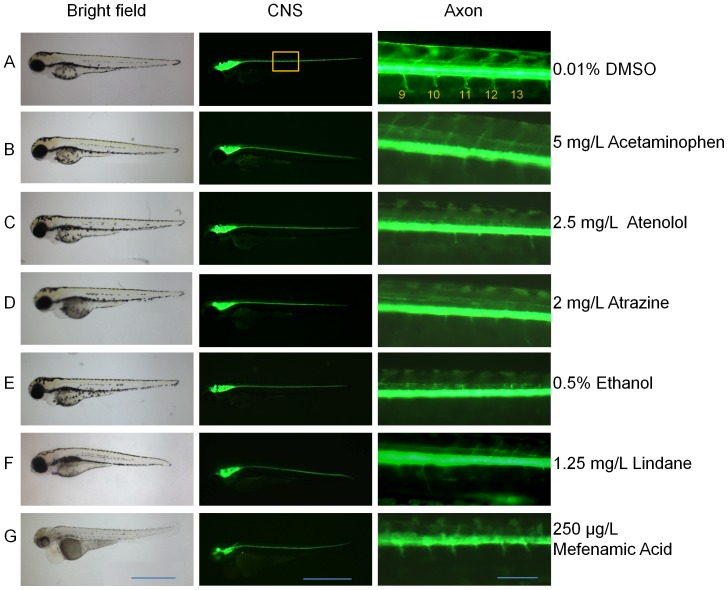
Figure 4. General phenotypes (left row), GFP-expressing central nervous systems (middle row) and motoneuron axons (right row) of 80-hpf Tg(nkx2.2a:mEGFP) fry in the presence of effective concentrations of different chemicals.
(A) 0.01% DMSO control, (B) 5 mg/L Acetaminophen, (C) 2.5 mg/L Atenolol, (D) 2 mg/L Atrazine, (E) 0.5% Ethanol, (F) 1.25 mg/L Lindane and (G) 250 µg/L Mefenamic acid. Somite numbers are indicated at the top right panel. Scale bars: 1000 µm for the left and middle rows and 100 µm for the right row.

