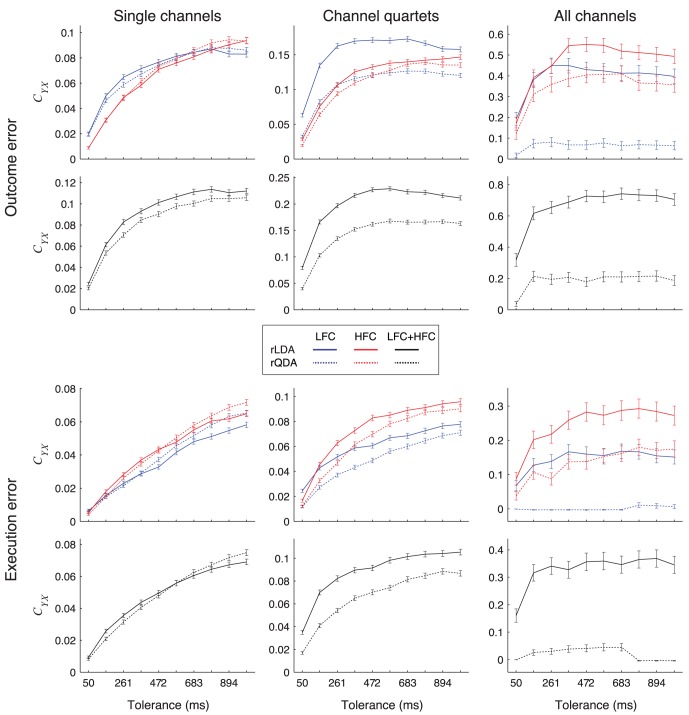
Figure 12. Detection results when using rLDA or rQDA classifiers.
CYX for detection of outcome (top) or execution (bottom) errors for different electrode set sizes, using LFC (blue lines), HFC (red lines) or both components together (black lines) and for rLDA (full lines) and rQDA (dotted lines) based detection algorithms, averaged over all subjects and all possible electrode subsets. Error bars show 95% confidence intervals.

