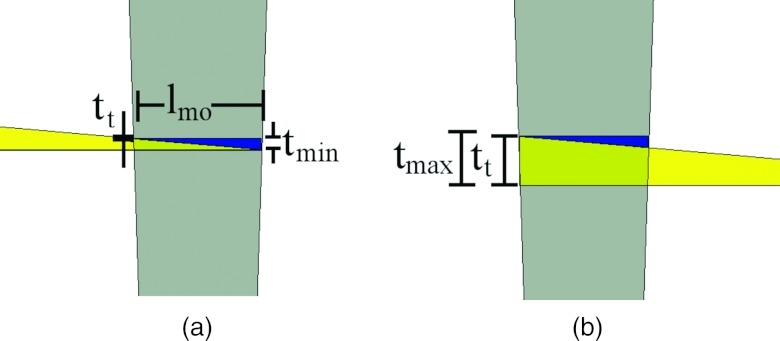
Figure 1.
Depiction of how the composite wedge thickness changes as a function of wedge overlap. (a) The wedge position of minimum overlap. (b) The position of maximum overlap. The gray trapezoid shown over the wedges represents the area irradiated by the x-ray cone beam. The width of the wedgelet at the position of the wedges is equal to lmo. Note: The images have been cropped in width so the entire moving wedge is not visible in either image. The stationary wedge is entirely visible in both images.

