
Figure 3.
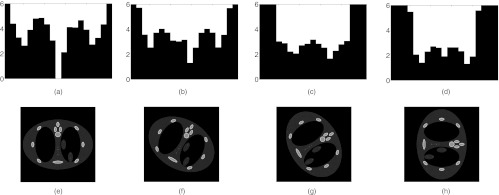
A demonstration of DBA-FFMCT. The top row represents wedge thicknesses (in this case the wedges were made of Fe and a monochromatic 50 keV imaging spectrum was used) required to equalize the detector signal for the phantom images displayed in the bottom row.