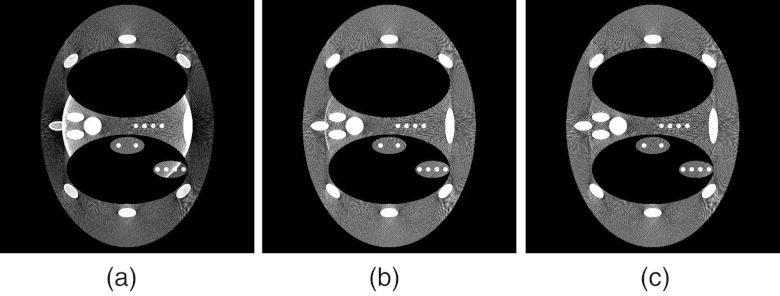
Figure 4.
Comparison of DBA images reconstructed without (a) and with (b) and (c) a beam hardening correction applied. In this example, scatter is not simulated and three wedge pairs were used. In (b), all rays were corrected assuming the path length was all soft tissue. In (c), all rays were corrected assuming the path length was 97% soft tissue and 3% bone. No noise was simulated, the “textured” background present in the images is due to view aliasing.

