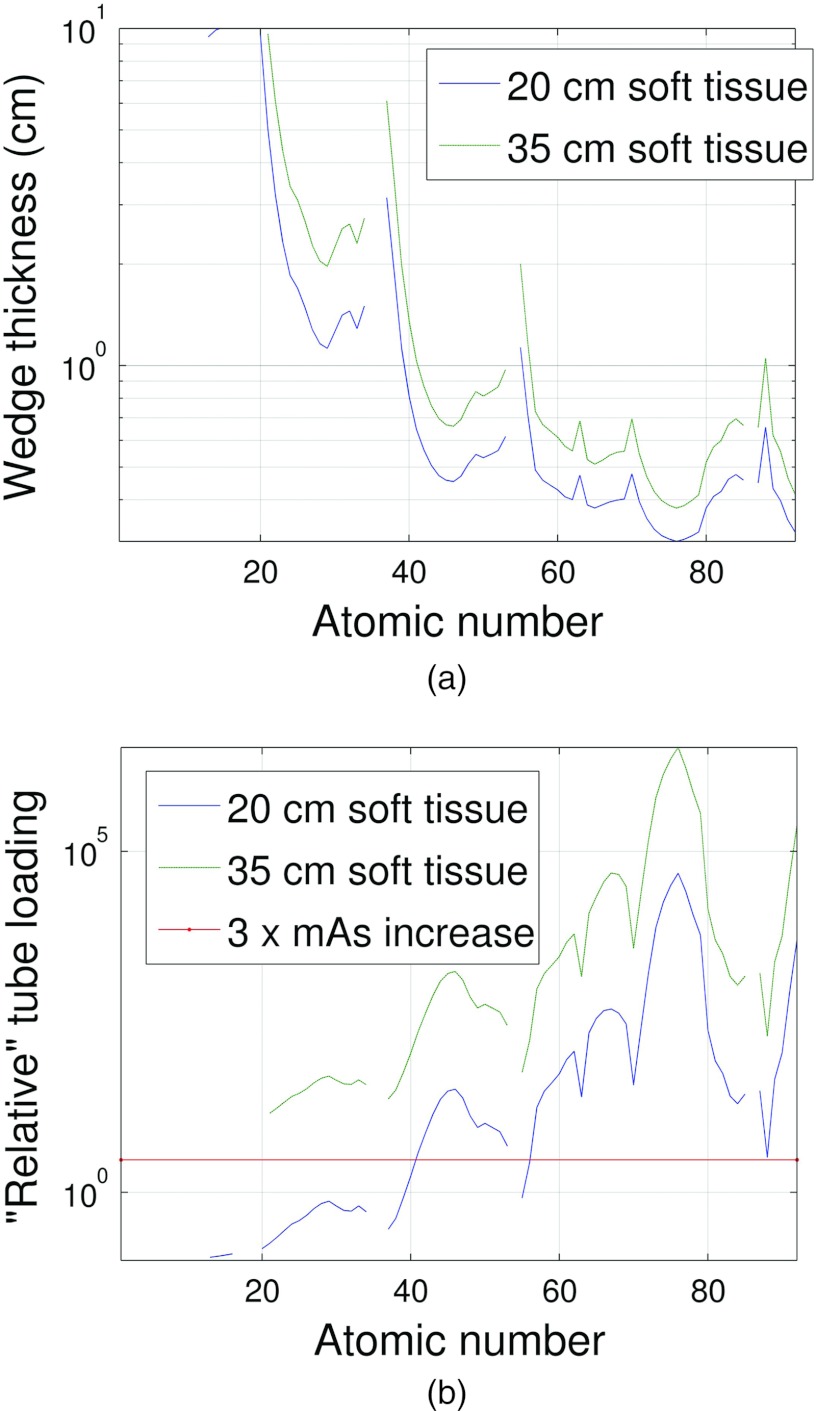
Figure 8.
(a) For each element, the tmax thickness required to match the attenuation of 20 and 25 cm of soft tissue plus tmin of wedge material is shown. The gaps in the plot represent th values outside of the range [0.1, 10] cm. It can be observed that above Al, most gaps in the plot are due to the noble gases. (b) The amount of tube loading required for each element represented as the increase in mAs required to match the detector signals between DBA and non-DBA scans for the thicknesses shown in (a). The system and wedge geometries listed in Table 2 configuration A were used to make these plots.

