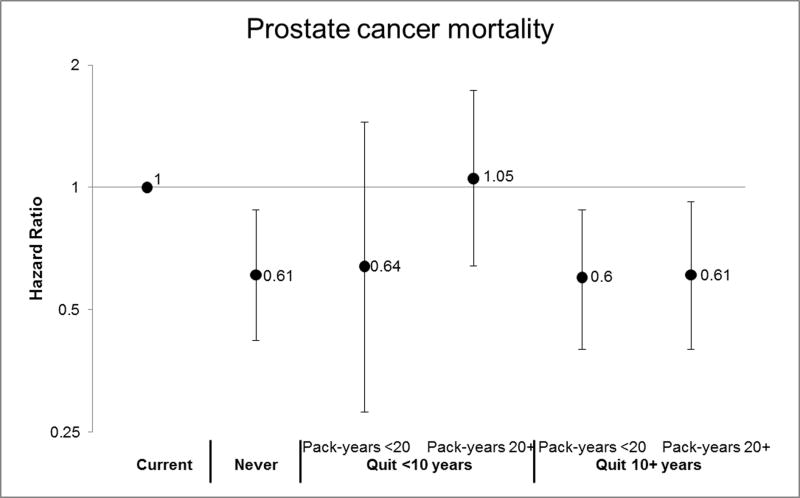
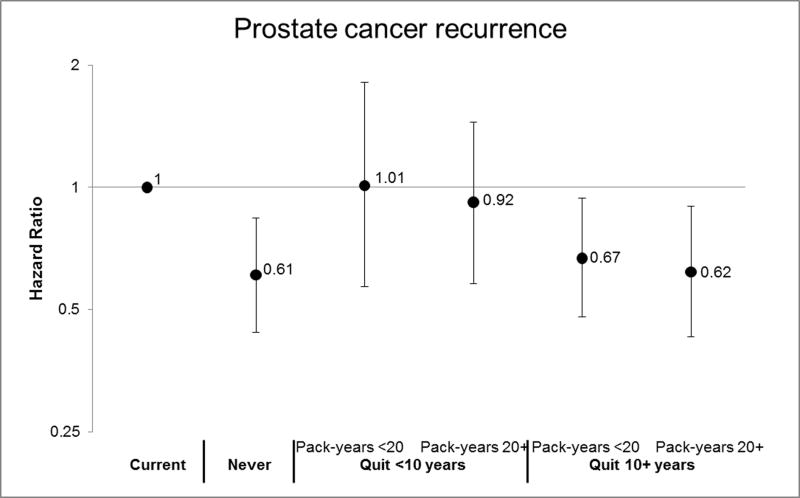
FIGURE 3.
Risk of Prostate Cancer Mortality and Recurrence by Smoking Status & Intensity
Now in separate EXCEL file (see Tab 1 for Mortality and Tab 2 for Recurrence).
See footnotes in Table 2 for variables included in the multivariable model. Current smokers are the reference group. Please see the table below for the number of participants and events included in the analysis.
| Total | Smoking Status prior to Diagnosis
|
||||||
|---|---|---|---|---|---|---|---|
| Quit <10 years | Quit 10+ years | ||||||
|
| |||||||
| Current | Never | >0 to <20 pack-years | 20+ pack-years | >0 to <20 pack-years | 20+ pack-years | ||
| Prostate cancer deaths | |||||||
| No. of Events | 499 | 41 | 219 | 8 | 33 | 119 | 79 |
| No. of Participants | 5084 | 277 | 2449 | 87 | 210 | 1361 | 702 |
| Biochemical recurrence | |||||||
| No. of Events | 835 | 51 | 392 | 18 | 38 | 229 | 107 |
| No. of Participants | 3442 | 147 | 1746 | 52 | 119 | 951 | 427 |


