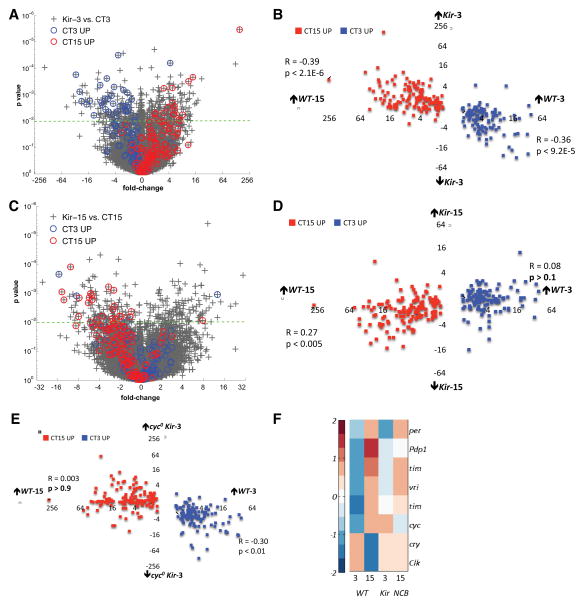
Figure 2. Hyperpolarizing LNvs at morning induces an evening-like circadian expression pattern.
(A&C) Scatter-plot of fold change versus p-value for all mRNAs in the Kir-3 vs. WT-3 (A) and Kir-15 vs. WT-15 (C) comparisons. Circadian genes (249) are identified with blue (high at WT-3) and red (high at WT-15) circles.
(B&D) Scatter-plot of wild type circadian fold differences (WT-3 vs. WT-15) for each of the 249 circadian mRNAs against their Kir-3 fold differences (Kir-3 vs. WT-3, B) and Kir-15-fold differences (Kir-15 vs. WT-15, D).
(E) Scatter-plot of wild type circadian fold differences (WT-3 vs. WT-15) for all circadian mRNAs against their cyc0; Kir-3 fold differences (cyc0; Kir-3 vs. WT-3).
(F) Expression values for core clock mRNAs (row) across four genomic conditions (columns) standardized by mean centering (row mean = 0, row standard deviation =1) and assigned color-map values based on their standard deviation from the row mean.

