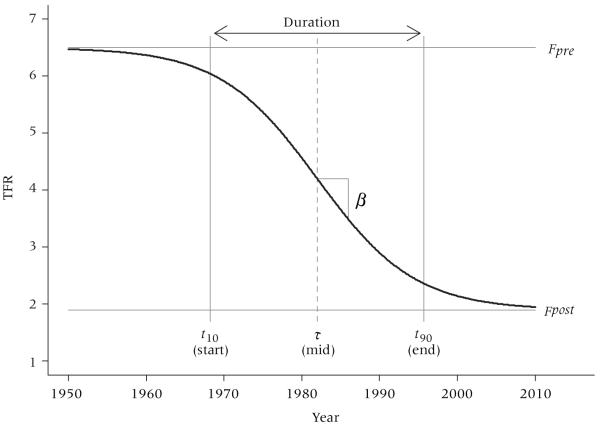
FIGURE 1. Logistic model of fertility transition applied to microregions in Brazil.
NOTE: Starting from a pretransition level Fpre, TFR declines toward a new level Fpost. Times t10, θ, and t90 are the points at which the transition is 10 percent, 50 percent, and 90 percent complete. Duration = t90–t10. (Curve as drawn shows a stylized transition in TFR from 6.5 to 1.9, centered around 1982.)

