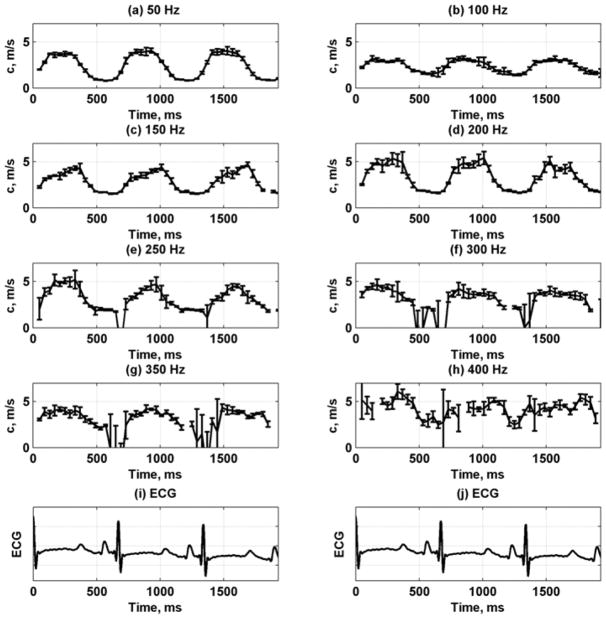
Fig. 13.
Phase velocity variation for 8 frequencies between 50–400 Hz by taking median through wall thickness from one animal. The error bars are the standard deviations from five consecutive acquisitions. (a) 50 Hz, (b) 100 Hz, (c) 150 Hz, (d) 200 Hz, (e) 250 Hz, (f) 300 Hz, (g) 350 Hz, (h) 400 Hz, (i) – (j) ECG trace for synchronization purposes.

