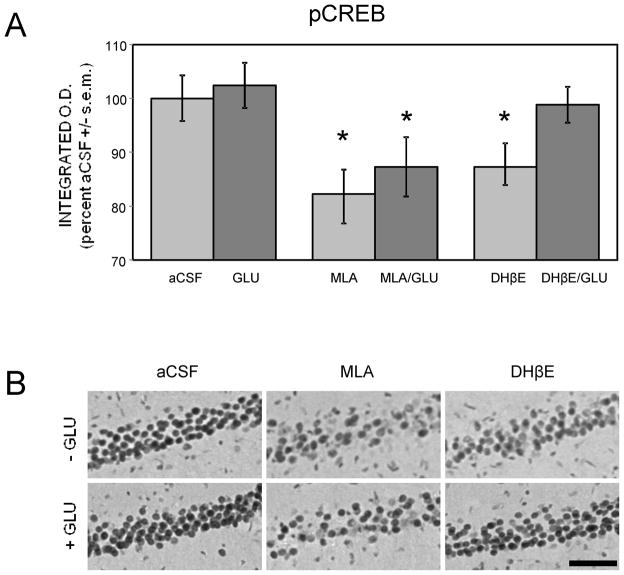
Figure 7.
Differences in pCREB immunoreactivity in area CA1 following spontaneous alternation testing with intrahippocampal administration of drugs. (A) MLA (6.75 μg/side) or DHβE (8 μg/side) reduced pCREB levels. Co-administration of glucose with the antagonists attenuated DHβE but not MLA-induced pCREB deficits. (*) ps < .05 vs. aCSF. Ns = 8 for aCSF and GLU. Ns = 7 for all other groups. (B) Representative photomicrographs of pCREB immunostaining in area CA1. Scale bar = 100 microns.

