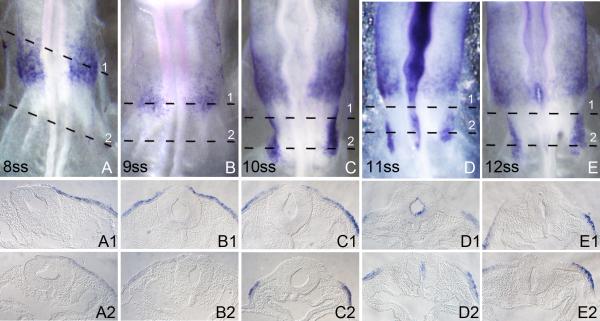
Figure 2.
The expression pattern of chick Foxi3 from stage 8ss to 12ss. Embryos were processed for whole mount in situ hybridization and then sectioned transversely at 18μm. All whole-mount embryo images are visualized dorsally. Numbers in each large panel refer to the embryonic age measured by the number of somites (ss). The level of each section is indicated by dashed lines. (A and B): Foxi3 expression is restricted to the future trigeminal region. Faint expression is seen in the surrounding presumptive otic/epibranchial region. This is the time when a second, more posterior patch of Foxi3 expression begins to appear. (C-E): Expression in the otic region is completely lost from the anterior otic placode region and restricted to the posterior placode. From this point, intense Foxi3 expression is seen in a second, more posterior region which becomes restricted to the second pharyngeal arch.

