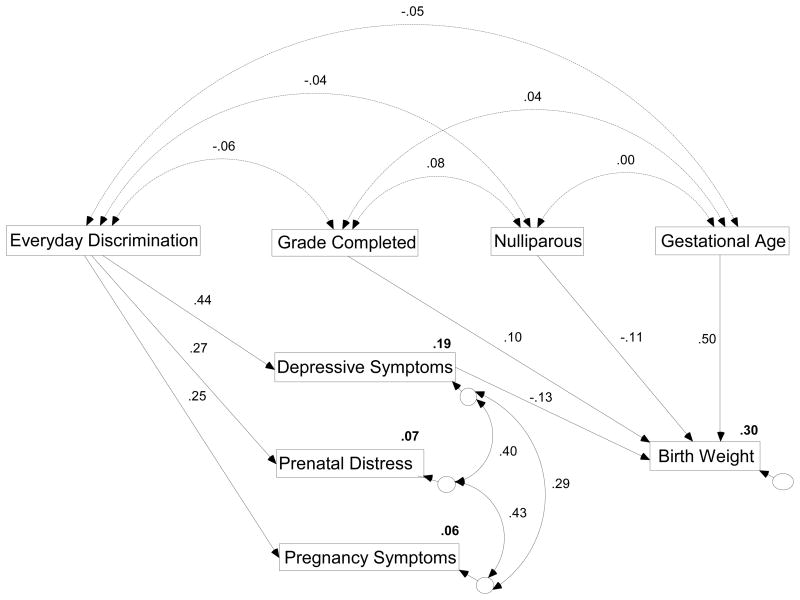
Figure 1.
Final path model of relationship between everyday discrimination and birth weight. Figure includes standardized regression weights for all non-trimmed paths, correlations, and squared multiple correlations in bold. All solid lines are statistically significant at p < .01, all dashed lines are non-statistically significant at p > .10.

