Fig. 5.

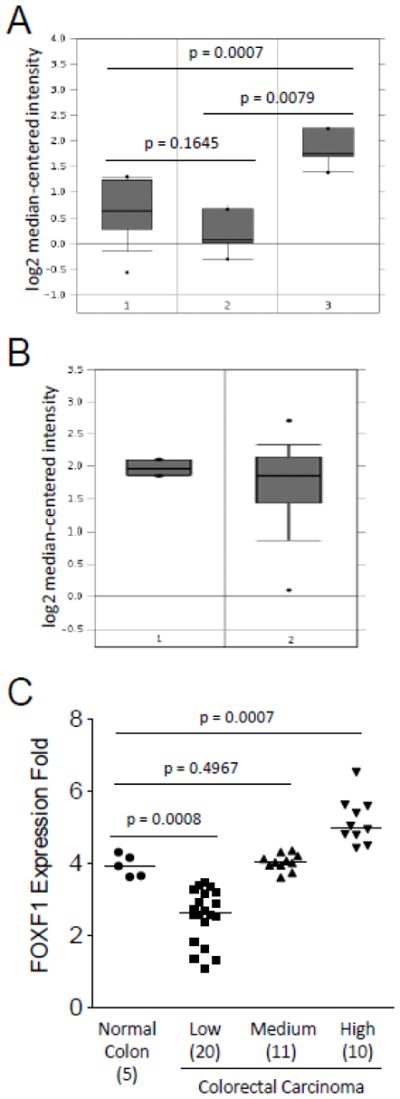
In silico analysis of FOXF1 mRNA expression in normal colon, benign and malignant colorectal tumors. The in silico expression data of the FOXF1 gene in normal colon, benign and malignant colorectal tumors were plotted based on Oncomine’s meta-analysis of previously published Skrzypczak’s (A) and Kaiser’s (B) microarray datasets. Y-axis units are normalized expression values on a log2 scale and the expression level of the FOXF1 gene was normalized across all microarray studies. The 25th and 75th percentiles are indicated by a vertical box and the 10th and 90th percentiles are depicted by error bars. The median of a dataset is shown as a horizontal line within a box. Outliers (indicated by dots) are also shown. The statistical analyses of differences between normal colon tissue, colorectal adenomas and carcinomas are indicated in the plot. The tissue samples in (A) are the following: 1-normal colon (n=10); 2-colorectal adenoma (n=5); 3-colorectal carcinoma (n=5). The tissue samples in (B) are the following: 1-normal colon (n=5); 2-colorectal adenocarcinoma (n=41). (C) FOXF1 expression data from Kaiser’s microarray dataset were plotted as a dot plot based on the expression classification of colorectal tumors (classified as low, medium and high). The statistical analyses of differences between normal colon tissue and different groups of colorectal tumors are indicated in the plot. The number of cases in each data group is indicated in parentheses. The median of a dataset is depicted by a horizontal line.
