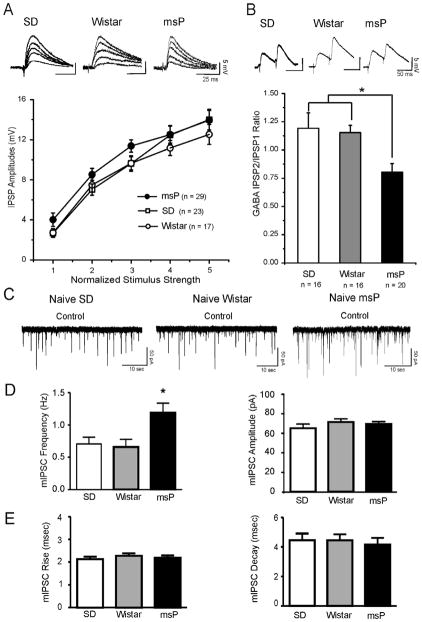
Figure 1.
A: Top Panel: Representative recordings of evoked GABAA-IPSP amplitudes in CeA neurons from Sprague Dawley (SD), Wistar and msP rats. Bottom Panel: The input-output curves of mean baseline GABAergic transmission are similar in CeA neurons from msP (n = 29), SD (n = 23) and Wistar rats (n = 17). B: Top Panel: Representative recordings of evoked 50 msec PPF of IPSPs in CeA neurons from msP, SD and Wistar rats. Bottom Panel: Histograms plotting the baseline PPF ratio of IPSPs in CeA neurons from msP, SD and Wistar rats. In the msP (n = 20) baseline PPF ratios are significantly (*p< 0.05; ANOVA) lower than SD (n = 16) and Wistar (n = 16) neurons. Error bars represent SEM. C: Representative mIPSC recordings in CeA neurons from SD, Wistar and msP rats. D: Left Panel: Mean ± SEM frequency of mIPSCs from CeA neurons from msP (n = 42), SD (n = 42) and Wistar (n = 16) rats. In msP rats the frequency of mIPSCs is significantly (*p< 0.05, ANOVA) higher than SD and Wistar rats. Right Panel: Mean ± SEM of the mIPSC amplitude in the three rat lines. E: Left Panel: Mean ± SEM rise time of mIPSCs from the CeA neurons from the msP, SD and Wistar rats (same neurons of Panel D). Right Panel: Mean ± SEM of the mIPSC decay time in the three rat lines. There are not significant differences in the three groups.

