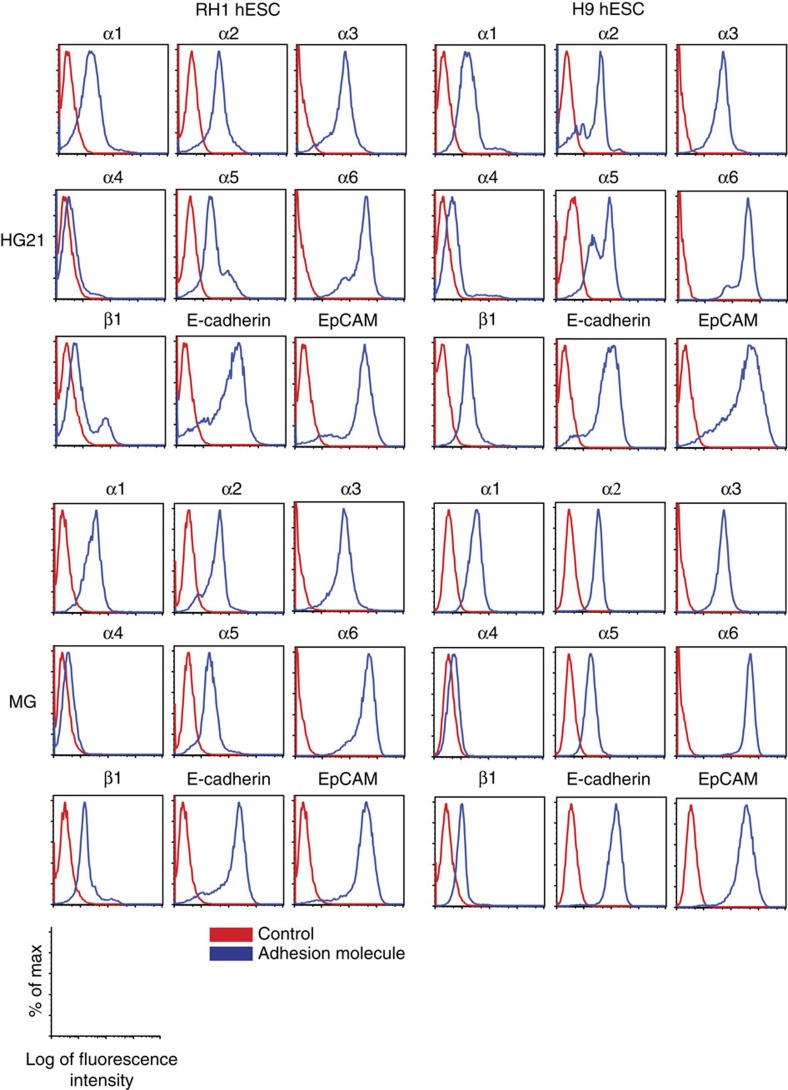
Figure 4. Analyses of hESC adhesion molecule expression.
RH1 (left panel sets) and H9 (right panel set) hESC cultured on HG21 (top panel sets) and Matrigel (MG, bottom panel sets) possess similar expression profiles for integrins α1–6, β1, EpCAM and E-cadherin, as assessed by flow cytometry. Vertical axis, percentage of maximum cell counts on a linear scale. Horizontal axis, fluorescence intensity on a log scale for control background (red) and adhesion molecule specific (blue) signal.

