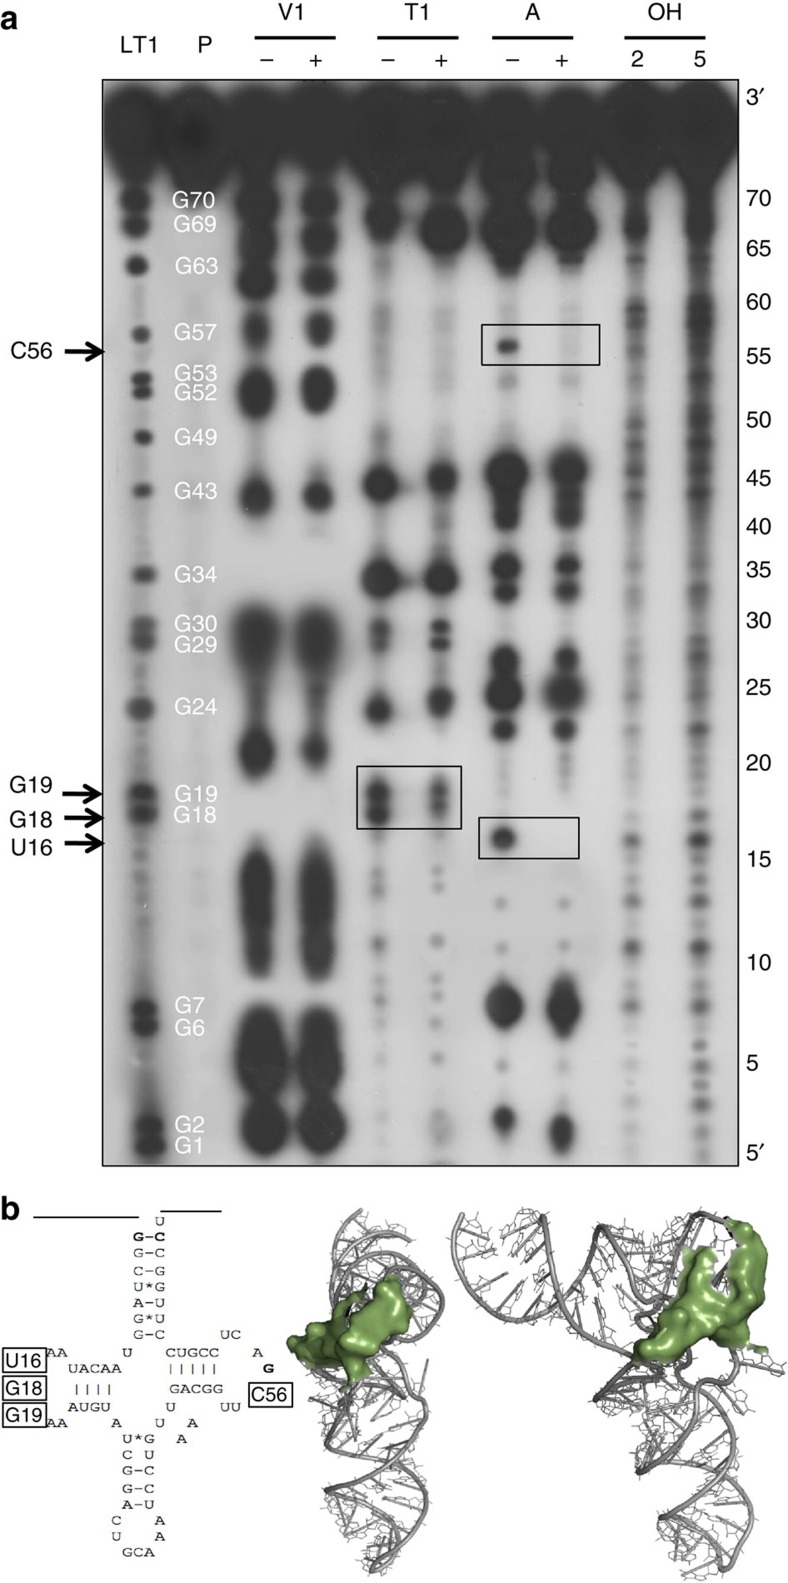
Figure 2. Footprinting analysis of mitochondrial tRNACys precursor in complex with PRORP1.
(a) Samples were subjected to partial RNase V1, RNase T1 and RNase A digestions. + and − mean that PRORP proteins were present or absent in the reactions. P represents the tRNA precursor probe. LT1 shows an RNase T1 ladder with the corresponding positions of Gs in the tRNA sequence indicated in white. OH show alkaline hydrolysis of the tRNA probe performed for 2 and 5 min to generate an RNA ladder with single-nucleotide increments. RNA samples were separated by high resolution denaturing PAGE. tRNA positions were precisely mapped with the T1 and alkaline ladders. Boxed positions, also indicated on the left by arrows, correspond to tRNA positions reproducibly found protected from nuclease treatment by PRORP interaction in three replicate experiments. (b) Secondary and tertiary structural model of mitochondrial tRNACys with boxes and green surfaces indicating residues protected by PRORP in footprinting experiments.

