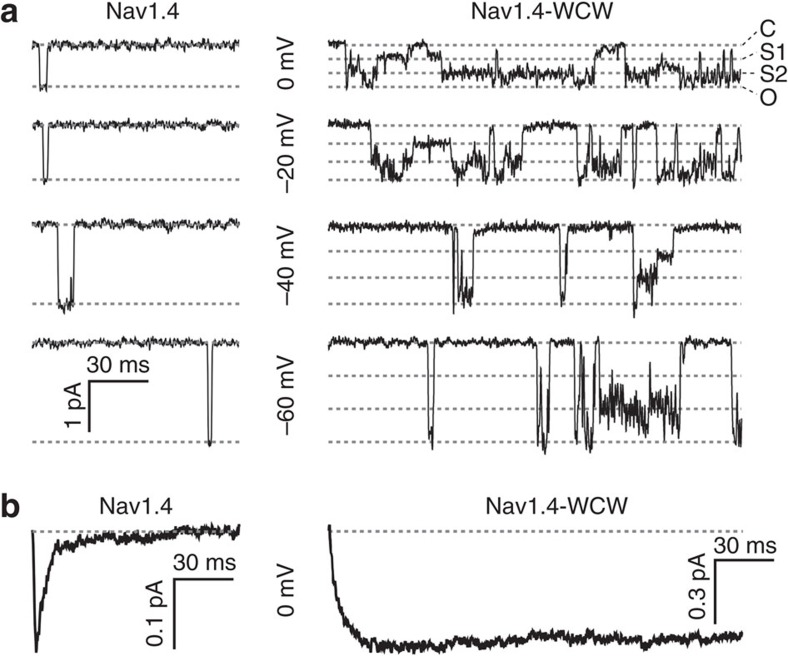
Figure 2. Multiple conductance levels during gating of single Nav1.4-WCW channels.
(a) Single channel records in response to 200 ms depolarizing pulses from −60 to 0 mV (−120 mV holding) for Nav1.4 (left, only first 100 ms shown) and Nav1.4-WCW (right) channels at 10 °C (filtered at 1 kHz for display). Dashed lines indicate observed conductance levels (C=closed, S1, S2, O; openings are downward). (b) Macroscopic responses obtained by averaging single channel records.

