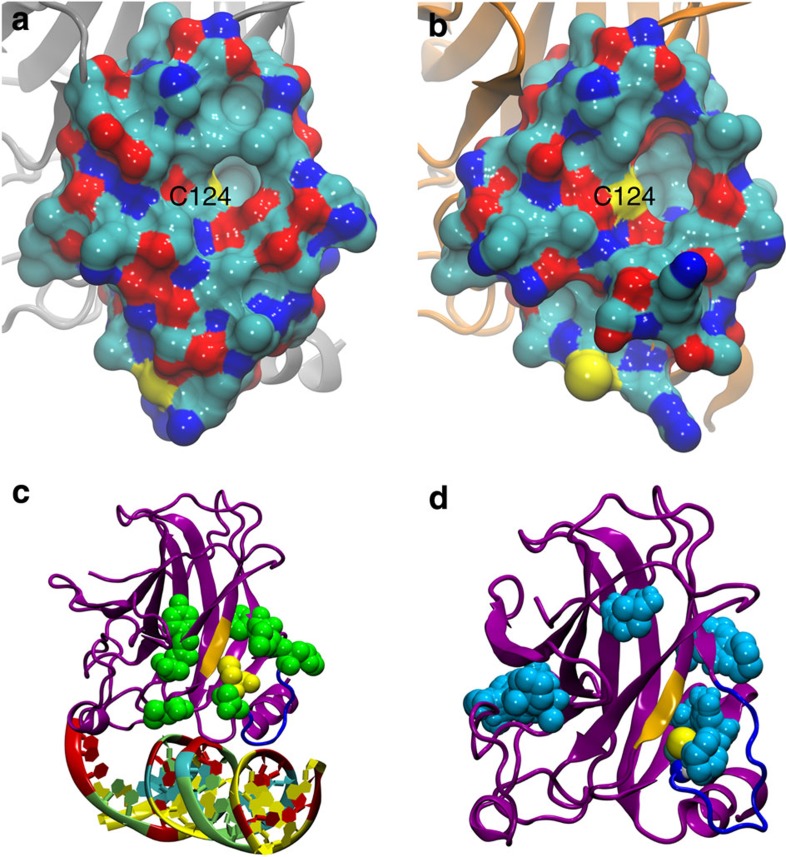
Figure 1. Molecular visualizations of the p53 core domain.
(a,b) All residues of the p53 core domain (1TSR-B33) within 10 Å of Cys124 are shown in a surface representation coloured by atom type: cyan, C; blue, N; red, O; yellow, S. (a) Cys124 is initially occluded in the wt crystal structure. (b) Structure extracted from MD simulations of mutant R273H reveals new breathing structural topography near Cys124 within the range of normal solution dynamics. (c,d) The p53 core domain is shown in magenta, loop L1 in blue, strand S3 in gold. (c) Cys124 (yellow) is surrounded by genetic mutation sites that can reactivate p53 function (green). (d) Druggable pockets (cyan) from FTMAP44 for the R273H mutant. The open L1/S3 pocket surrounds Cys124 (yellow).

