
Figure 6.
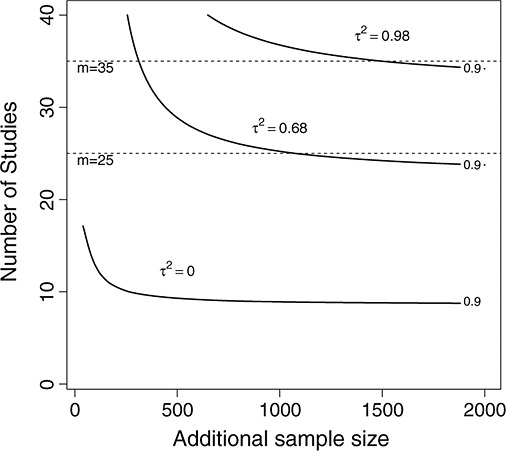
Contours for conditional power of 90% for an updated meta-analysis to detect a standardized mean difference of − 0.5, having observed a standardized mean difference of − 0.58 (95% CI − 1.43 to 0.27), based on a meta-analysis of allergic rhinitis symptom scores after sublingual immunotherapy for allergic rhinitis caused by house dust mites 19. The graph illustrates the relationship between additional information size (expressed as sample size) and number of planned studies for three values of future heterogeneity,  .
.