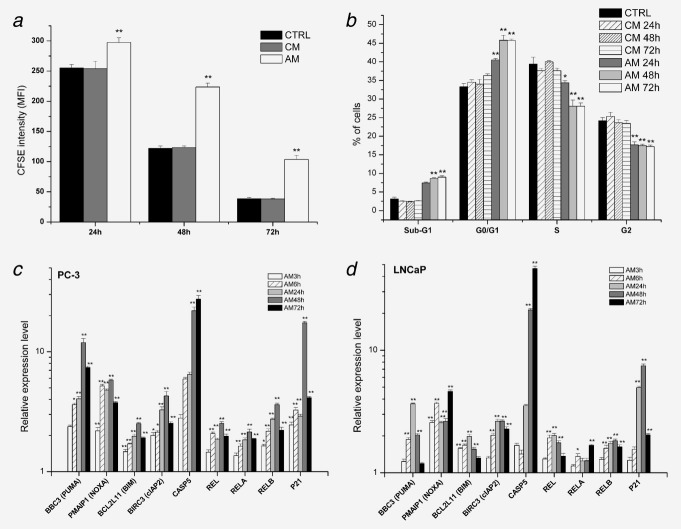
Figure 5.
AM inhibits proliferation, induces G1 arrest, and influences gene expression in PC-3 cells. (a) Cell division tracking of CM or AM treated cells with CFSE. The mean fluorescence intensity (MFI) is plotted against the treatment lengths. (b) Cell cycle analysis of cells treated with AM using propidium iodide staining. (c) Quantitative RT-PCR analysis of gene expression in AM treated PC-3 cells. (d), As in c, but LNCaP cells were treated. Data are presented as mean ± SEM of three independent experiments. *p < 0.05, **p < 0.001 (ANOVA).

