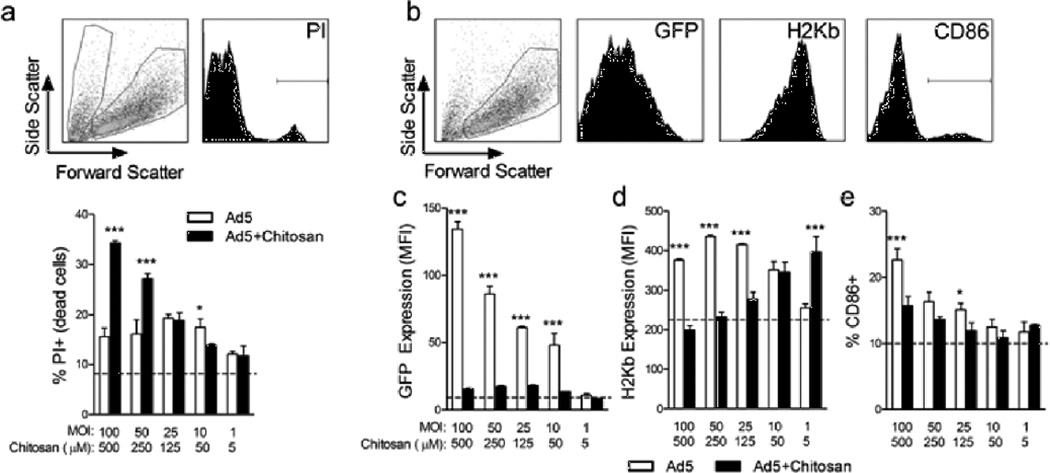
Figure 7.
Complexation of adenovirus with chitosan significantly reduces viability and activation of primary BMDCs. C57BL/6 BMDCs were infected in vitro for 24 hrs with Ad5-OVA or Ad5–GFP +/− chitosan at final viral MOIs of 100, 50, 25, 10 or 1 and final chitosan concentrations of 500, 250, 125, 50 or 5 µM. (a) Representative dot and histogram plots of BMDCs stained with PI to detect dead cells (scatter dot plot: left gate contains PI+ dead cells; right gate contains PI− live cells); statistical analysis of %PI+ dead cells/treatment group. (b) Representative dot and histogram plots (gated on live cells) of GFP, H-2Kb and CD86 expression. (c–e) Statistical analysis of GFP MFI, H-2Kb MFI and %CD86+ cells/treatment group. Dotted line represents levels observed in uninfected control cells. Means ± SD from treatment groups performed in triplicate are shown. *, p<0.05, **, ***, p<0.001.

