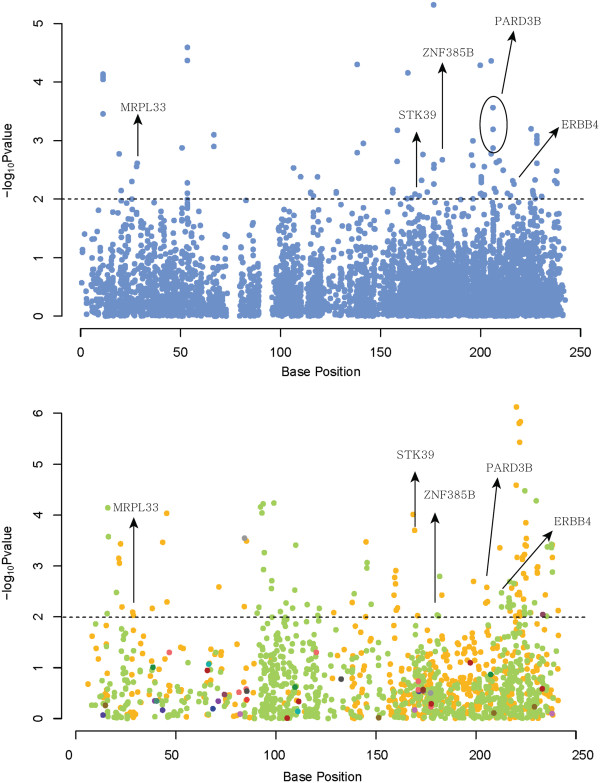
Figure 3.
Genome-wide association study results of pig and human on chromosome 2. GWAS results are plotted as negative log-transformed P values associated for SUB (above) and BFT. Common genes were identified with SNPs that exceeded the significance threshold of 0.01. The orange points denote the region syntenic to pig chromosome 3; green ones to pig chromosome 15. Other colours represent minor syntenic portions other than chromosome 3 and 15.

